
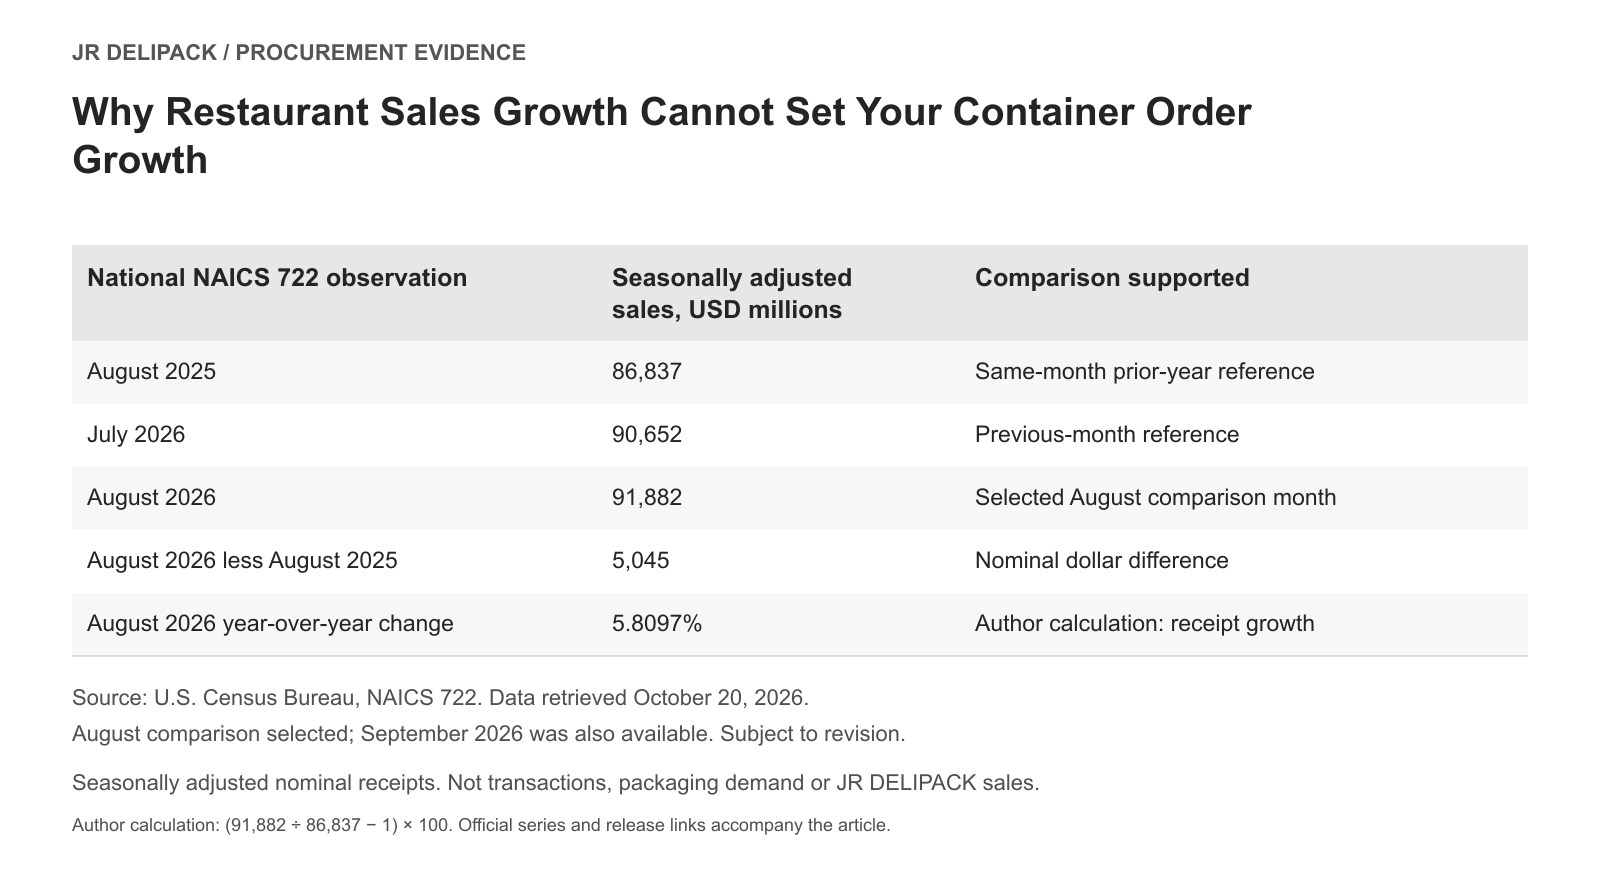
A 5.8% rise in national foodservice sales does not justify a 5.8% increase in container orders: U.S. seasonally adjusted food services and drinking places sales rose from $86.837 billion in August 2025 to $91.882 billion in August 2026, but these figures measure receipts, not transactions or packaging pieces. Those values come from the Census series retrieved on October 20, 2026; the percentage is our calculation, rounded from 5.8097%. Source: U.S. Census Bureau, food services and drinking places adjusted sales [1]. Source: Census release, Table 1, p. 5 (USD millions; NAICS 722) [2].
For a packaging distributor, the useful question is what must be known before revenue growth becomes a defensible physical-volume assumption. The answer requires a bridge between customer transactions, service channels, menu mix, and the packaging used for each transaction. A national receipt figure belongs at the beginning of that conversation. It cannot supply all the missing steps.
This guide develops that bridge for a purchasing or commercial review. Its output is a documented order-volume assumption with visible evidence gaps. It does not calculate reorder points or prescribe a stock buffer. Those are later inventory decisions, made after the demand assumption and its units have been established.
What does the national sales number actually establish?
Census describes the published adjusted series as accounting for seasonal, holiday, and trading-day differences, while leaving price changes in the results. Therefore a dollar increase can coexist with a much smaller increase in meals served, or with different movement in transactions. Seasonal adjustment does not turn nominal receipts into physical output. Source: Census time-series notes [3].
The following figures are a reference point for discussing the national operating environment. They are not JR DELIPACK sales, distributor revenue, customer order counts, or packaging consumption. Keeping those distinctions in the table title prevents a large national dollar figure from acquiring a more specific meaning as it moves between presentations.
| National NAICS 722 observation | Seasonally adjusted sales, USD millions | Comparison supported |
|---|---|---|
| August 2025 | 86,837 | Same-month prior-year reference |
| July 2026 | 90,652 | Previous-month reference |
| August 2026 | 91,882 | Selected same-month year-over-year comparison |
| August 2026 less August 2025 | 5,045 | Nominal dollar difference |
| August 2026 year-over-year change | 5.8097% | Calculated receipt growth |
Table source: Census adjusted food services and drinking places series, snapshot retrieved October 20, 2026. Differences and percentages are author calculations from the displayed values. Direct series [1].
The Census Bureau says its advance estimates are revised one month later by estimates from the Monthly Retail Trade and Food Services Survey (MRTS). Keep every value in this comparison within one retrieval vintage. Census advance sales methodology [4].
The arithmetic is straightforward: divide 91,882 by 86,837, subtract one, and multiply by one hundred. The difficult part is not the calculation. It is identifying whether a distributor's customers resemble the businesses behind that aggregate and whether their spending changes imply anything about a particular packaging format. A correct percentage attached to the wrong operating measure still produces a weak purchasing decision.
Where does revenue stop being a reliable proxy for transactions?
At a customer level, receipts can be represented as transactions multiplied by average revenue per transaction, provided both measures cover the same business activity. If transaction definitions are stable, that identity helps separate physical activity from ticket value. It is an analytical relationship, not a claim that Census supplies either component for this packaging exercise.
Ask the customer or account manager what counts as a transaction. A delivery order containing several meals may be recorded as one transaction. A catering invoice may represent many portions. A customer might count checks, orders, tickets, guests, or meals, and those words are not interchangeable. Preserve the original definition before aggregating accounts. Otherwise the apparent precision of a single total hides different units.
Average revenue per transaction can also move when customers choose different items or buy larger baskets. A distributor should not label every ticket increase inflation without suitable evidence. Nor should a purchasing team divide national restaurant sales by a plastic-resin index to estimate meal counts. The price of a broad packaging input does not provide a restaurant transaction deflator or a container-demand denominator.
For an account with usable records, compare receipts and transactions over identical dates. Ask whether tax, tips, delivery charges, refunds, and third-party fees receive consistent treatment in the two extracts. This is a reconciliation question for that account, not a universal accounting prescription. An apparent gap caused by a changed data export should be resolved before it becomes a procurement explanation.
How do service channels change the packaging requirement?
After transactions, identify the share that requires the packaging being purchased. Dine-in, takeaway, delivery, catering, and prepared-food retail can have different physical requirements even when they generate similar receipts. The relevant distinction is the actual use of each item. Some operations use disposable containers for more than one channel; others use them for only part of a channel.
Do not assign a universal packaging rate to a label such as restaurant takeout. Map the workflow: which menu item enters which base, whether a separate lid is used, which accompaniments receive portion cups, and whether the order requires additional components. The restaurant takeout application page is an appropriate starting point for discussing that service context. It does not provide a national packaging-per-order statistic.
An increase in delivery share could raise packaging use while total transactions remain unchanged. A shift toward dine-in could have the opposite effect for some products. These are possible mechanisms to test against customer records, not findings about the current U.S. market. The national sales table cannot tell a distributor which of these changes occurred within its own accounts.
The bridge should therefore retain a channel field, a definition, an observation period, and an evidence owner. If the channel share is unknown, write unknown. Replacing the gap with a national receipt-growth rate makes the model look complete but removes the very uncertainty the buyer needs to discuss.
How should a buyer build the physical-volume bridge?
For a defined customer and period, a practical starting relationship is qualifying transactions multiplied by the average number of approved packaging units used per qualifying transaction. Where channel exposure differs, calculate each channel separately before adding the results. This is a proposed analytical method; the inputs must come from the buyer's own records or clearly identified assumptions.
Keep food containers, separate lids, hinged units, and accessory cups visible as separate outputs when they are separately purchased. A menu change can alter one component without affecting another. For example, moving sauce into a dedicated cup would change the component map even if the number of main meals stayed constant. That is a hypothetical workflow change, not a recommendation or an observed customer practice.
Use actual issue records or operating counts to check the resulting physical total. Purchased quantities are a useful cross-check, but they can reflect receiving timing, stock changes, returns, or exceptional orders. Explain the reconciliation difference rather than forcing the demand estimate to equal every invoice. The aim is to understand consumption, not to manufacture a perfect-looking equality from incompatible records.
When product selection itself remains unresolved, consult the food-type matching guide. It helps frame the intended application before a consumption assumption is assigned. It should not be treated as proof that a particular model is suitable for every food, temperature, or handling process. Product evidence and the economic bridge answer different questions.
What does a transparent sensitivity example look like?
An illustrative calculation can show why the national percentage cannot be copied into an order plan. Assume, solely for demonstration, that a customer's qualifying transactions rise 2% while average packaging units per qualifying transaction fall 1%. Multiplying 1.02 by 0.99 gives 1.0098, equivalent to a 0.98% increase in physical packaging use. These assumptions are invented for arithmetic and are not measured U.S. demand, customer results, or a forecast.
Now keep the same assumed transaction growth but increase the packaging units per transaction by 3%. Multiplying 1.02 by 1.03 produces 1.0506, or 5.06% physical growth. The two outcomes differ because the operational input changed. Neither was inferred from Census receipts, and neither establishes what an actual buyer should order.
| Illustrative sensitivity only | Transaction multiplier | Units-per-transaction multiplier | Calculated physical-use change |
|---|---|---|---|
| Lower component intensity | 1.02 | 0.99 | +0.98% |
| Higher component intensity | 1.02 | 1.03 | +5.06% |
Table note: hypothetical inputs selected to explain multiplication; no external dataset or JR DELIPACK forecast is represented. The national 5.8097% receipt change remains a separate observation from the Census series [1].
For a live account, replace the illustrative multipliers with values calculated from that account's transaction and component-use records for the same period; keep unobserved inputs explicitly assumed. If transaction growth, channel mix, and component intensity all move together without explanation, managers cannot tell which assumption drives the result. Give each proposed change a reason and an owner. Where the evidence is weak, show a range as a scenario and leave the eventual buying commitment for a separate approval.
Frequently Asked Questions
How should mixed customer portfolios be handled?
A distributor serving different customer types needs an account-level or segment-level bridge before forming a portfolio total. A catering customer may have event-driven activity, while a takeaway chain may have more frequent transactions. Their sales measures and packaging patterns can differ enough that one shared multiplier conceals the commercial exposure rather than simplifying it.
Weight physical-demand calculations by the relevant physical base. If the question concerns container pieces, begin with comparable container usage or an explicitly defined set of components. Revenue weighting answers a different question. A high-ticket account can carry substantial dollar weight while using fewer containers than a lower-ticket account. The weighting choice should be printed beside the result.
Separate continuing accounts from newly won, lost, opened, or closed accounts. A national market growth rate does not include the distributor's individual account gains as a distinct explanatory item. If a sales plan already includes a signed new customer, adding another unexplained market-growth allowance on that same volume risks counting opportunity twice. The bridge should show exactly where incremental volume enters.
Accounts without usable records should remain visible. Grouping them into a residual line is acceptable when its limitations are stated, but the residual should not quietly receive the most optimistic assumption. A buyer may choose to investigate the largest uncertain account first because it changes the decision more than refining an already well-understood small account.
Which checks make the assumption usable in a buying meeting?
Begin the meeting with the proposed physical outcome and the evidence that supports it. Then explain the national context. This ordering discourages the familiar mistake of starting with an impressive market headline and asking the operations team to make its numbers conform. The commercial and purchasing teams should be able to disagree with the national trend when their own comparable records support a different conclusion.
A reviewable assumption should answer the following questions:
- Which customer group, service channel, product configuration, and period does the estimate cover?
- Are receipts, transactions, meals, complete sets, and separate components distinguished?
- Which inputs are observed, which are customer estimates, and which remain scenarios?
- Have new accounts, lost accounts, promotions, and menu changes been identified separately?
- Does actual component usage support the proposed units-per-transaction relationship?
- What evidence would change the decision before a purchase commitment is made?
Record both supporting and contradictory evidence. If transactions are flat while receipts are growing, that is useful information rather than a defect to smooth away. If a new packaging process increases component use, document the process change instead of attributing it to market growth. The purpose of the bridge is to explain the physical assumption in terms the buyer can verify.
The food packaging supply for distributors page can help frame a supplier discussion once the account and application scope are clear. It does not replace customer-side demand evidence. JR DELIPACK supplies PP, PLA, and paper packaging; the appropriate product configuration, supporting documents, commercial terms, and availability must be confirmed for the specific enquiry.
How can the team validate a bridge before relying on it?
Test the bridge against a completed operating period before using it for a future one. Choose an interval for which the customer can provide both its activity measure and packaging-use records. Build the estimate using the definitions that would have been available at the time, then compare the predicted component requirement with observed use. This is a practical reconciliation exercise, not a claim of statistical forecasting accuracy.
Investigate the difference by component. A close total may conceal excess bases and insufficient lids, while a wide overall difference may come from one irregular catering event. The useful question is whether the discrepancy exposes a missing workflow, a definition problem, or normal variation. Do not improve the fit by inventing an unobserved explanation or retroactively changing every assumption without leaving a record.
A customer with limited data can begin with a bounded observation exercise. Count a clearly defined service channel and its associated packaging during a representative period chosen by the operator. Note unusual promotions, closures, and menu substitutions. The resulting observation describes that interval only. It should be labeled provisional until the buyer understands how it behaves under the other service conditions that matter to the account.
Assign responsibility for maintaining each input. Sales may know about upcoming accounts and promotions; an operator may own transaction definitions; purchasing may maintain the approved component map. Those assignments are a proposed workflow rather than a required organizational structure. What matters is that a changed menu, order definition, or component arrangement reaches the person maintaining the physical assumption before it becomes an unexplained purchasing variance.
Finally, preserve the last accepted bridge alongside the new one. Show which inputs changed and why the physical result moved. This creates a useful conversation about evidence instead of a contest between two unexplained growth percentages. It also makes it easier to distinguish a genuine demand change from a correction to the way the company counted demand.
What are the limits of this analysis?
This national Census series covers food services and drinking places and reports nominal dollars. It does not isolate takeaway meals, single-use packaging, individual materials, JR DELIPACK customers, or a distributor's territory. This comparison deliberately uses August 2026 for the same-month year-over-year comparison; September 2026 sales are also available in the October 20 retrieval. Refresh the source before relying on a later publication. Sources: Census adjusted series [1] and series definitions and adjustment notes [3].
The proposed operating bridge is a decision framework, not a validated forecasting model. Its usefulness depends on consistent transaction definitions and representative component-use observations. An account's past relationship can change after a menu redesign, an acquisition, a service-channel shift, or a new packaging workflow. Record those breaks instead of assuming that a historical ratio must continue.
For a supplier conversation, send the relevant customer application, current approved components, observed usage period, transaction definition, and the changes being considered through the JR DELIPACK contact page. Ask what product-specific information is needed to evaluate the requirement. Ask how the quoted purchasing unit maps to the separate components in your usage estimate. A national increase of 5.8% is a reason to review the assumptions; the order-volume decision should rest on the physical activity your own evidence can support.
Connect the operating assumption to the broader product-and-supplier decision using the wholesale food-container buying guide. The guide supplies the broader purchasing context; the decision developed here remains specific to this article. For a product-specific supply discussion, review the JR DELIPACK product range alongside your specification brief. Use JR DELIPACK’s quality information page to organise supporting-document questions alongside the product brief.
References
- [1] U.S. Census Bureau. U.S. Census Bureau published dataset: adv72200.txt. n.d. (publication date not provided). Retrieved October 20, 2026 (source snapshot date; not a publication date). https://www.census.gov/retail/marts/www/adv72200.txt
- [2] U.S. Census Bureau. ADVANCE MONTHLY SALES FOR RETAIL AND FOOD SERVICES, SEPTEMBER 2026. 2026-10-15. https://www.census.gov/retail/marts/www/marts_current.pdf
- [3] U.S. Census Bureau. Time Series Data. n.d. (publication date not provided). https://www.census.gov/retail/marts/www/timeseries.html
- [4] U.S. Census Bureau. Advance Monthly Retail Trade Survey. n.d. (publication date not provided). https://www.census.gov/retail/marts/how_surveys_are_collected.html