Why Restaurant Sales Growth Cannot Set Your Container Order Growth

U.S. foodservice nominal sales in August 2025, July 2026 and August 2026, with a calculated 5.8097 percent August year-over-year rise; not packaging unit demand.

A 5.8% rise in national foodservice sales does not justify a 5.8% increase in container orders: U.S. seasonally adjusted food services and drinking places sales rose from $86.837 billion in August 2025 to $91.882 billion in August 2026, but these figures measure receipts, not transactions or packaging pieces. Those values come from the Census series retrieved on October 20, 2026; the percentage is our calculation, rounded from 5.8097%. Source: U.S. Census Bureau, food services and drinking places adjusted sales [1]. Source: Census release, Table 1, p. 5 (USD millions; NAICS 722) [2].

For a packaging distributor, the useful question is what must be known before revenue growth becomes a defensible physical-volume assumption. The answer requires a bridge between customer transactions, service channels, menu mix, and the packaging used for each transaction. A national receipt figure belongs at the beginning of that conversation. It cannot supply all the missing steps.

This guide develops that bridge for a purchasing or commercial review. Its output is a documented order-volume assumption with visible evidence gaps. It does not calculate reorder points or prescribe a stock buffer. Those are later inventory decisions, made after the demand assumption and its units have been established.

What does the national sales number actually establish?

Census describes the published adjusted series as accounting for seasonal, holiday, and trading-day differences, while leaving price changes in the results. Therefore a dollar increase can coexist with a much smaller increase in meals served, or with different movement in transactions. Seasonal adjustment does not turn nominal receipts into physical output. Source: Census time-series notes [3].

The following figures are a reference point for discussing the national operating environment. They are not JR DELIPACK sales, distributor revenue, customer order counts, or packaging consumption. Keeping those distinctions in the table title prevents a large national dollar figure from acquiring a more specific meaning as it moves between presentations.

National NAICS 722 observationSeasonally adjusted sales, USD millionsComparison supported
August 202586,837Same-month prior-year reference
July 202690,652Previous-month reference
August 202691,882Selected same-month year-over-year comparison
August 2026 less August 20255,045Nominal dollar difference
August 2026 year-over-year change5.8097%Calculated receipt growth

Table source: Census adjusted food services and drinking places series, snapshot retrieved October 20, 2026. Differences and percentages are author calculations from the displayed values. Direct series [1].

The Census Bureau says its advance estimates are revised one month later by estimates from the Monthly Retail Trade and Food Services Survey (MRTS). Keep every value in this comparison within one retrieval vintage. Census advance sales methodology [4].

The arithmetic is straightforward: divide 91,882 by 86,837, subtract one, and multiply by one hundred. The difficult part is not the calculation. It is identifying whether a distributor's customers resemble the businesses behind that aggregate and whether their spending changes imply anything about a particular packaging format. A correct percentage attached to the wrong operating measure still produces a weak purchasing decision.

Where does revenue stop being a reliable proxy for transactions?

At a customer level, receipts can be represented as transactions multiplied by average revenue per transaction, provided both measures cover the same business activity. If transaction definitions are stable, that identity helps separate physical activity from ticket value. It is an analytical relationship, not a claim that Census supplies either component for this packaging exercise.

Ask the customer or account manager what counts as a transaction. A delivery order containing several meals may be recorded as one transaction. A catering invoice may represent many portions. A customer might count checks, orders, tickets, guests, or meals, and those words are not interchangeable. Preserve the original definition before aggregating accounts. Otherwise the apparent precision of a single total hides different units.

Average revenue per transaction can also move when customers choose different items or buy larger baskets. A distributor should not label every ticket increase inflation without suitable evidence. Nor should a purchasing team divide national restaurant sales by a plastic-resin index to estimate meal counts. The price of a broad packaging input does not provide a restaurant transaction deflator or a container-demand denominator.

For an account with usable records, compare receipts and transactions over identical dates. Ask whether tax, tips, delivery charges, refunds, and third-party fees receive consistent treatment in the two extracts. This is a reconciliation question for that account, not a universal accounting prescription. An apparent gap caused by a changed data export should be resolved before it becomes a procurement explanation.

How do service channels change the packaging requirement?

After transactions, identify the share that requires the packaging being purchased. Dine-in, takeaway, delivery, catering, and prepared-food retail can have different physical requirements even when they generate similar receipts. The relevant distinction is the actual use of each item. Some operations use disposable containers for more than one channel; others use them for only part of a channel.

Do not assign a universal packaging rate to a label such as restaurant takeout. Map the workflow: which menu item enters which base, whether a separate lid is used, which accompaniments receive portion cups, and whether the order requires additional components. The restaurant takeout application page is an appropriate starting point for discussing that service context. It does not provide a national packaging-per-order statistic.

An increase in delivery share could raise packaging use while total transactions remain unchanged. A shift toward dine-in could have the opposite effect for some products. These are possible mechanisms to test against customer records, not findings about the current U.S. market. The national sales table cannot tell a distributor which of these changes occurred within its own accounts.

The bridge should therefore retain a channel field, a definition, an observation period, and an evidence owner. If the channel share is unknown, write unknown. Replacing the gap with a national receipt-growth rate makes the model look complete but removes the very uncertainty the buyer needs to discuss.

How should a buyer build the physical-volume bridge?

For a defined customer and period, a practical starting relationship is qualifying transactions multiplied by the average number of approved packaging units used per qualifying transaction. Where channel exposure differs, calculate each channel separately before adding the results. This is a proposed analytical method; the inputs must come from the buyer's own records or clearly identified assumptions.

Keep food containers, separate lids, hinged units, and accessory cups visible as separate outputs when they are separately purchased. A menu change can alter one component without affecting another. For example, moving sauce into a dedicated cup would change the component map even if the number of main meals stayed constant. That is a hypothetical workflow change, not a recommendation or an observed customer practice.

Use actual issue records or operating counts to check the resulting physical total. Purchased quantities are a useful cross-check, but they can reflect receiving timing, stock changes, returns, or exceptional orders. Explain the reconciliation difference rather than forcing the demand estimate to equal every invoice. The aim is to understand consumption, not to manufacture a perfect-looking equality from incompatible records.

When product selection itself remains unresolved, consult the food-type matching guide. It helps frame the intended application before a consumption assumption is assigned. It should not be treated as proof that a particular model is suitable for every food, temperature, or handling process. Product evidence and the economic bridge answer different questions.

What does a transparent sensitivity example look like?

An illustrative calculation can show why the national percentage cannot be copied into an order plan. Assume, solely for demonstration, that a customer's qualifying transactions rise 2% while average packaging units per qualifying transaction fall 1%. Multiplying 1.02 by 0.99 gives 1.0098, equivalent to a 0.98% increase in physical packaging use. These assumptions are invented for arithmetic and are not measured U.S. demand, customer results, or a forecast.

Now keep the same assumed transaction growth but increase the packaging units per transaction by 3%. Multiplying 1.02 by 1.03 produces 1.0506, or 5.06% physical growth. The two outcomes differ because the operational input changed. Neither was inferred from Census receipts, and neither establishes what an actual buyer should order.

Illustrative sensitivity onlyTransaction multiplierUnits-per-transaction multiplierCalculated physical-use change
Lower component intensity1.020.99+0.98%
Higher component intensity1.021.03+5.06%

Table note: hypothetical inputs selected to explain multiplication; no external dataset or JR DELIPACK forecast is represented. The national 5.8097% receipt change remains a separate observation from the Census series [1].

For a live account, replace the illustrative multipliers with values calculated from that account's transaction and component-use records for the same period; keep unobserved inputs explicitly assumed. If transaction growth, channel mix, and component intensity all move together without explanation, managers cannot tell which assumption drives the result. Give each proposed change a reason and an owner. Where the evidence is weak, show a range as a scenario and leave the eventual buying commitment for a separate approval.

Frequently Asked Questions

How should mixed customer portfolios be handled?

A distributor serving different customer types needs an account-level or segment-level bridge before forming a portfolio total. A catering customer may have event-driven activity, while a takeaway chain may have more frequent transactions. Their sales measures and packaging patterns can differ enough that one shared multiplier conceals the commercial exposure rather than simplifying it.

Weight physical-demand calculations by the relevant physical base. If the question concerns container pieces, begin with comparable container usage or an explicitly defined set of components. Revenue weighting answers a different question. A high-ticket account can carry substantial dollar weight while using fewer containers than a lower-ticket account. The weighting choice should be printed beside the result.

Separate continuing accounts from newly won, lost, opened, or closed accounts. A national market growth rate does not include the distributor's individual account gains as a distinct explanatory item. If a sales plan already includes a signed new customer, adding another unexplained market-growth allowance on that same volume risks counting opportunity twice. The bridge should show exactly where incremental volume enters.

Accounts without usable records should remain visible. Grouping them into a residual line is acceptable when its limitations are stated, but the residual should not quietly receive the most optimistic assumption. A buyer may choose to investigate the largest uncertain account first because it changes the decision more than refining an already well-understood small account.

Which checks make the assumption usable in a buying meeting?

Begin the meeting with the proposed physical outcome and the evidence that supports it. Then explain the national context. This ordering discourages the familiar mistake of starting with an impressive market headline and asking the operations team to make its numbers conform. The commercial and purchasing teams should be able to disagree with the national trend when their own comparable records support a different conclusion.

A reviewable assumption should answer the following questions:

  • Which customer group, service channel, product configuration, and period does the estimate cover?
  • Are receipts, transactions, meals, complete sets, and separate components distinguished?
  • Which inputs are observed, which are customer estimates, and which remain scenarios?
  • Have new accounts, lost accounts, promotions, and menu changes been identified separately?
  • Does actual component usage support the proposed units-per-transaction relationship?
  • What evidence would change the decision before a purchase commitment is made?

Record both supporting and contradictory evidence. If transactions are flat while receipts are growing, that is useful information rather than a defect to smooth away. If a new packaging process increases component use, document the process change instead of attributing it to market growth. The purpose of the bridge is to explain the physical assumption in terms the buyer can verify.

The food packaging supply for distributors page can help frame a supplier discussion once the account and application scope are clear. It does not replace customer-side demand evidence. JR DELIPACK supplies PP, PLA, and paper packaging; the appropriate product configuration, supporting documents, commercial terms, and availability must be confirmed for the specific enquiry.

How can the team validate a bridge before relying on it?

Test the bridge against a completed operating period before using it for a future one. Choose an interval for which the customer can provide both its activity measure and packaging-use records. Build the estimate using the definitions that would have been available at the time, then compare the predicted component requirement with observed use. This is a practical reconciliation exercise, not a claim of statistical forecasting accuracy.

Investigate the difference by component. A close total may conceal excess bases and insufficient lids, while a wide overall difference may come from one irregular catering event. The useful question is whether the discrepancy exposes a missing workflow, a definition problem, or normal variation. Do not improve the fit by inventing an unobserved explanation or retroactively changing every assumption without leaving a record.

A customer with limited data can begin with a bounded observation exercise. Count a clearly defined service channel and its associated packaging during a representative period chosen by the operator. Note unusual promotions, closures, and menu substitutions. The resulting observation describes that interval only. It should be labeled provisional until the buyer understands how it behaves under the other service conditions that matter to the account.

Assign responsibility for maintaining each input. Sales may know about upcoming accounts and promotions; an operator may own transaction definitions; purchasing may maintain the approved component map. Those assignments are a proposed workflow rather than a required organizational structure. What matters is that a changed menu, order definition, or component arrangement reaches the person maintaining the physical assumption before it becomes an unexplained purchasing variance.

Finally, preserve the last accepted bridge alongside the new one. Show which inputs changed and why the physical result moved. This creates a useful conversation about evidence instead of a contest between two unexplained growth percentages. It also makes it easier to distinguish a genuine demand change from a correction to the way the company counted demand.

What are the limits of this analysis?

This national Census series covers food services and drinking places and reports nominal dollars. It does not isolate takeaway meals, single-use packaging, individual materials, JR DELIPACK customers, or a distributor's territory. This comparison deliberately uses August 2026 for the same-month year-over-year comparison; September 2026 sales are also available in the October 20 retrieval. Refresh the source before relying on a later publication. Sources: Census adjusted series [1] and series definitions and adjustment notes [3].

The proposed operating bridge is a decision framework, not a validated forecasting model. Its usefulness depends on consistent transaction definitions and representative component-use observations. An account's past relationship can change after a menu redesign, an acquisition, a service-channel shift, or a new packaging workflow. Record those breaks instead of assuming that a historical ratio must continue.

For a supplier conversation, send the relevant customer application, current approved components, observed usage period, transaction definition, and the changes being considered through the JR DELIPACK contact page. Ask what product-specific information is needed to evaluate the requirement. Ask how the quoted purchasing unit maps to the separate components in your usage estimate. A national increase of 5.8% is a reason to review the assumptions; the order-volume decision should rest on the physical activity your own evidence can support.

Connect the operating assumption to the broader product-and-supplier decision using the wholesale food-container buying guide. The guide supplies the broader purchasing context; the decision developed here remains specific to this article. For a product-specific supply discussion, review the JR DELIPACK product range alongside your specification brief. Use JR DELIPACK’s quality information page to organise supporting-document questions alongside the product brief.
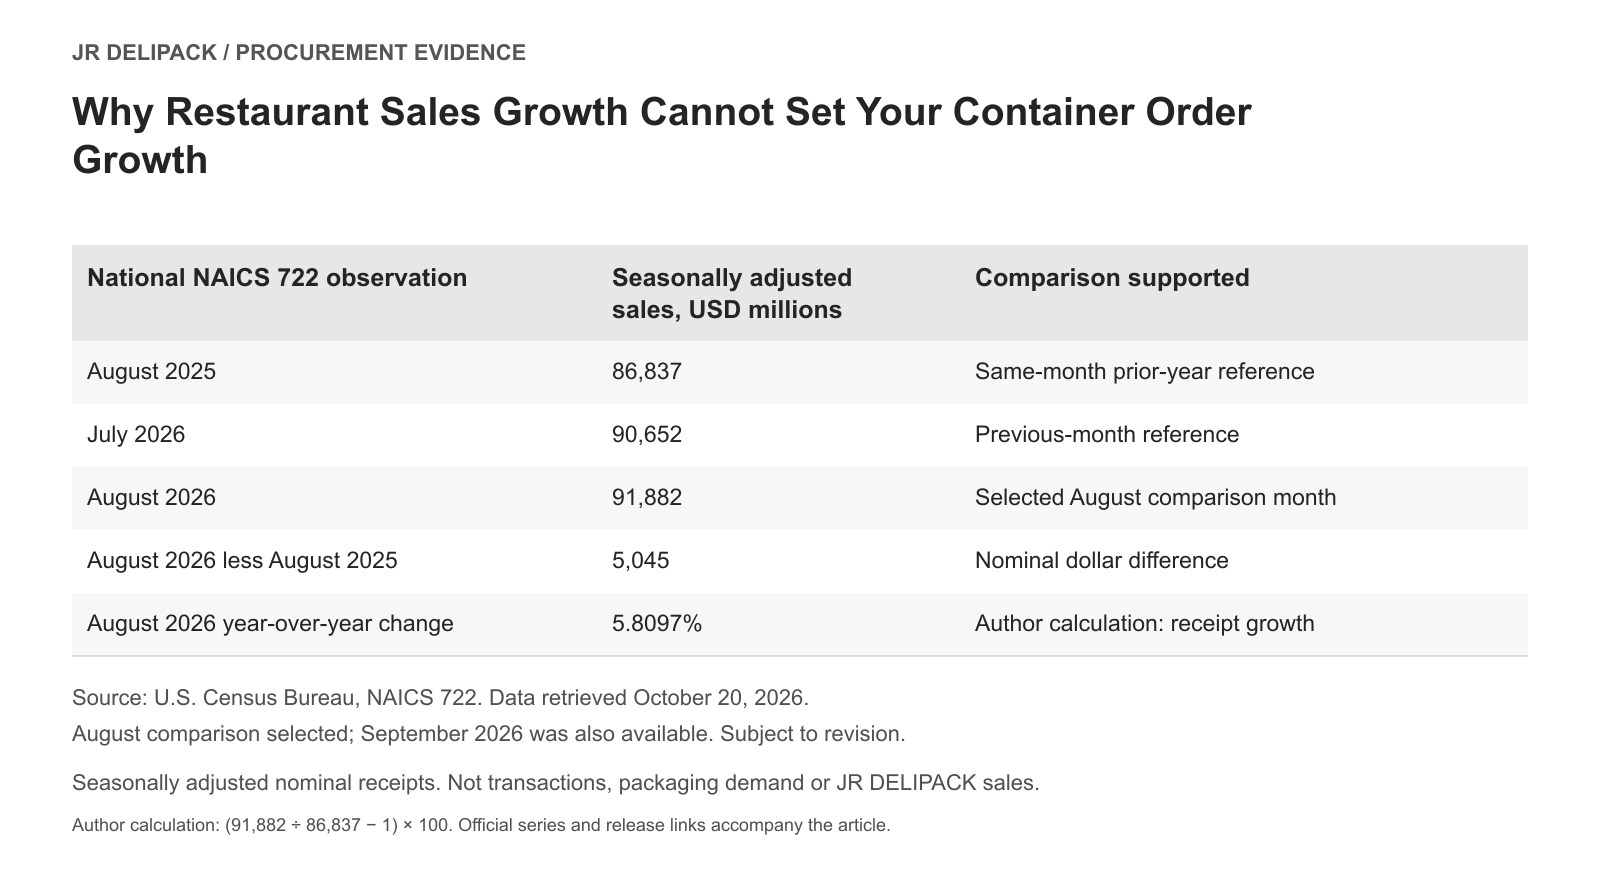
U.S. foodservice nominal sales in August 2025, July 2026 and August 2026, with a calculated 5.8097 percent August year-over-year rise; not packaging unit demand.
Figure: U.S. Census food services and drinking places seasonally adjusted nominal sales, in USD millions, retrieved October 20, 2026. The August comparison uses 86,837 for 2025 and 91,882 for 2026; the 5,045 difference and 5.8097% increase are author calculations. July 2026 is shown for context. September sales are also available; this figure deliberately compares August with the same month a year earlier. National receipts are not packaging-unit demand. Census adjusted sales: https://www.census.gov/retail/marts/www/adv72200.txt.

References

  1. [1] U.S. Census Bureau. U.S. Census Bureau published dataset: adv72200.txt. n.d. (publication date not provided). Retrieved October 20, 2026 (source snapshot date; not a publication date). https://www.census.gov/retail/marts/www/adv72200.txt
  2. [2] U.S. Census Bureau. ADVANCE MONTHLY SALES FOR RETAIL AND FOOD SERVICES, SEPTEMBER 2026. 2026-10-15. https://www.census.gov/retail/marts/www/marts_current.pdf
  3. [3] U.S. Census Bureau. Time Series Data. n.d. (publication date not provided). https://www.census.gov/retail/marts/www/timeseries.html
  4. [4] U.S. Census Bureau. Advance Monthly Retail Trade Survey. n.d. (publication date not provided). https://www.census.gov/retail/marts/how_surveys_are_collected.html
How Should Buyers Check Carton Dimension Units and Cubic Volume Before Freight Booking?

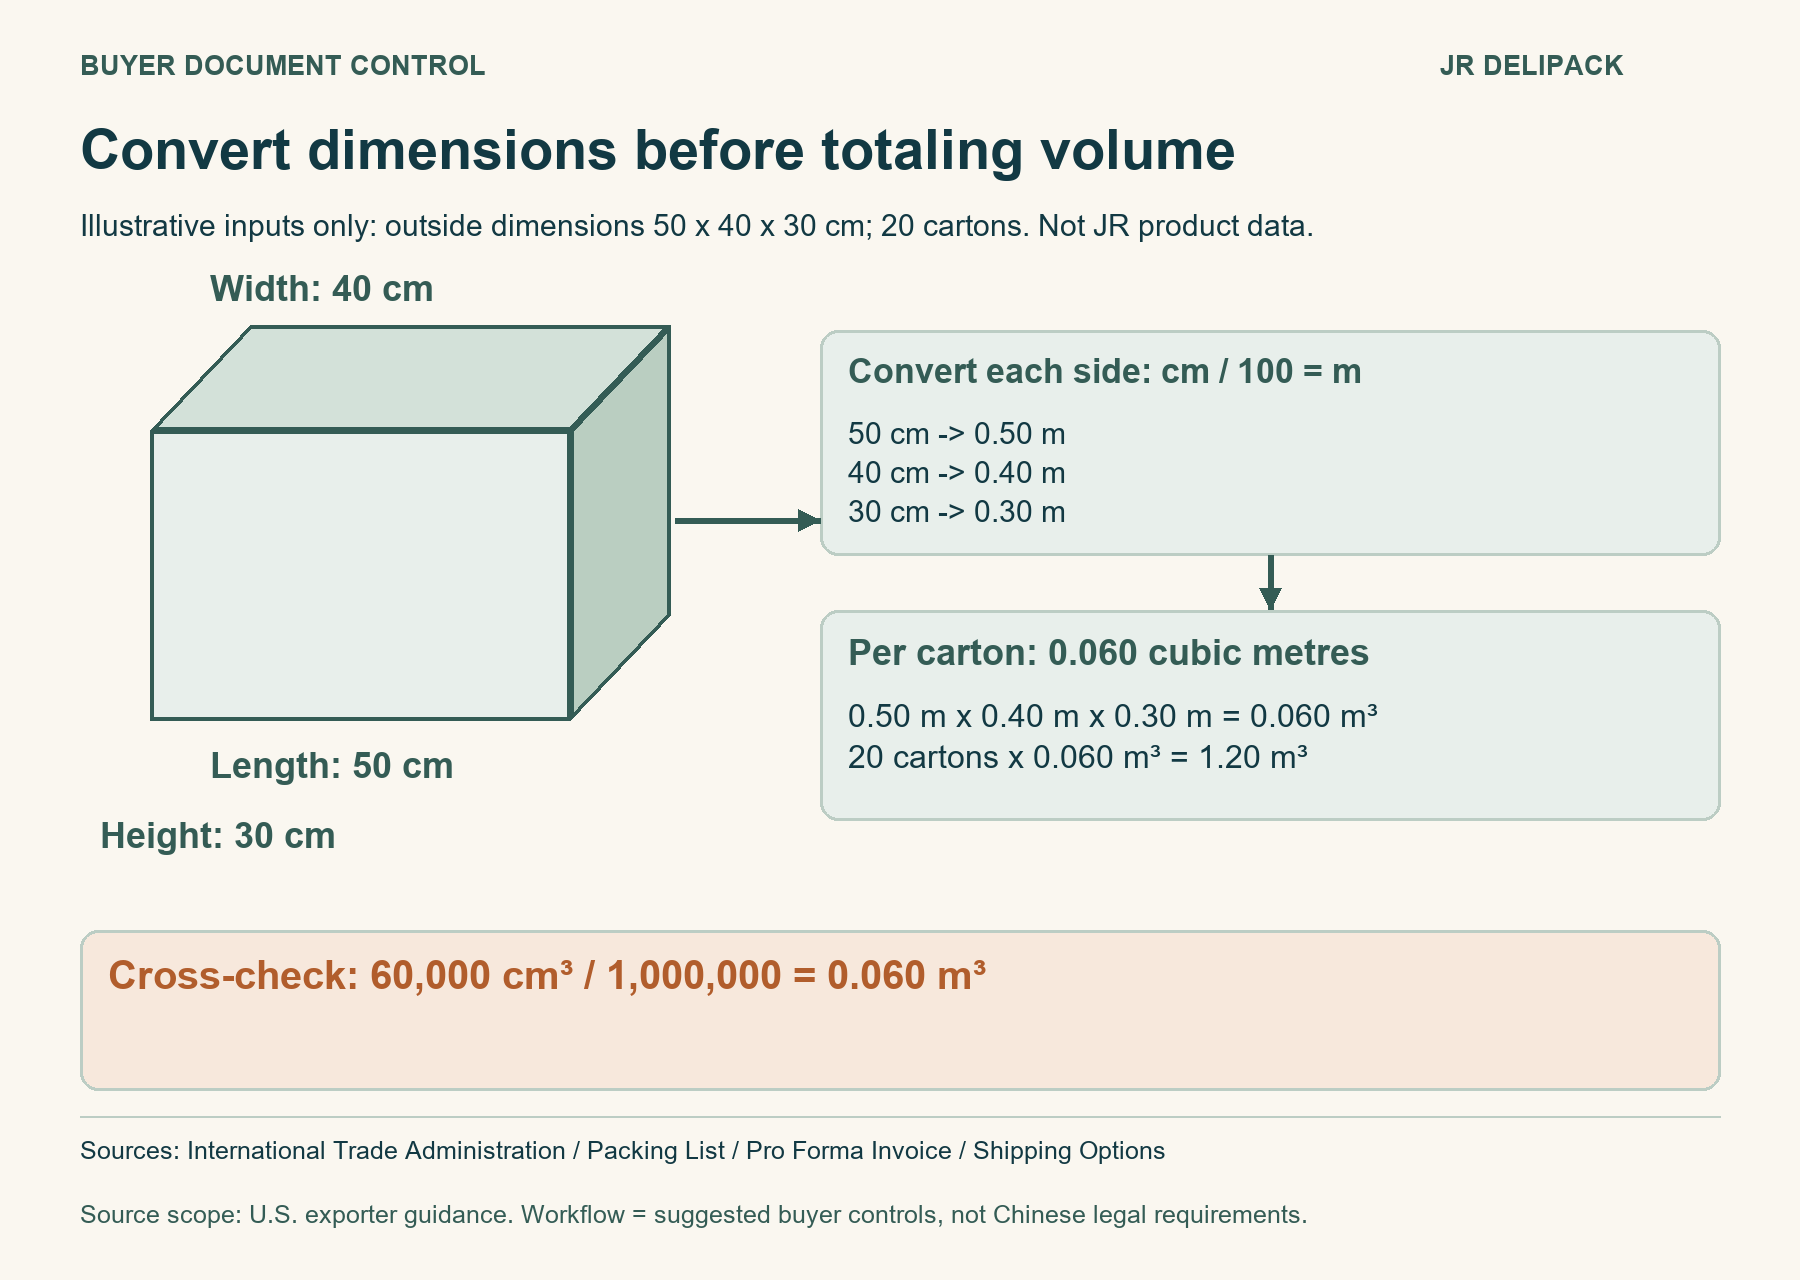
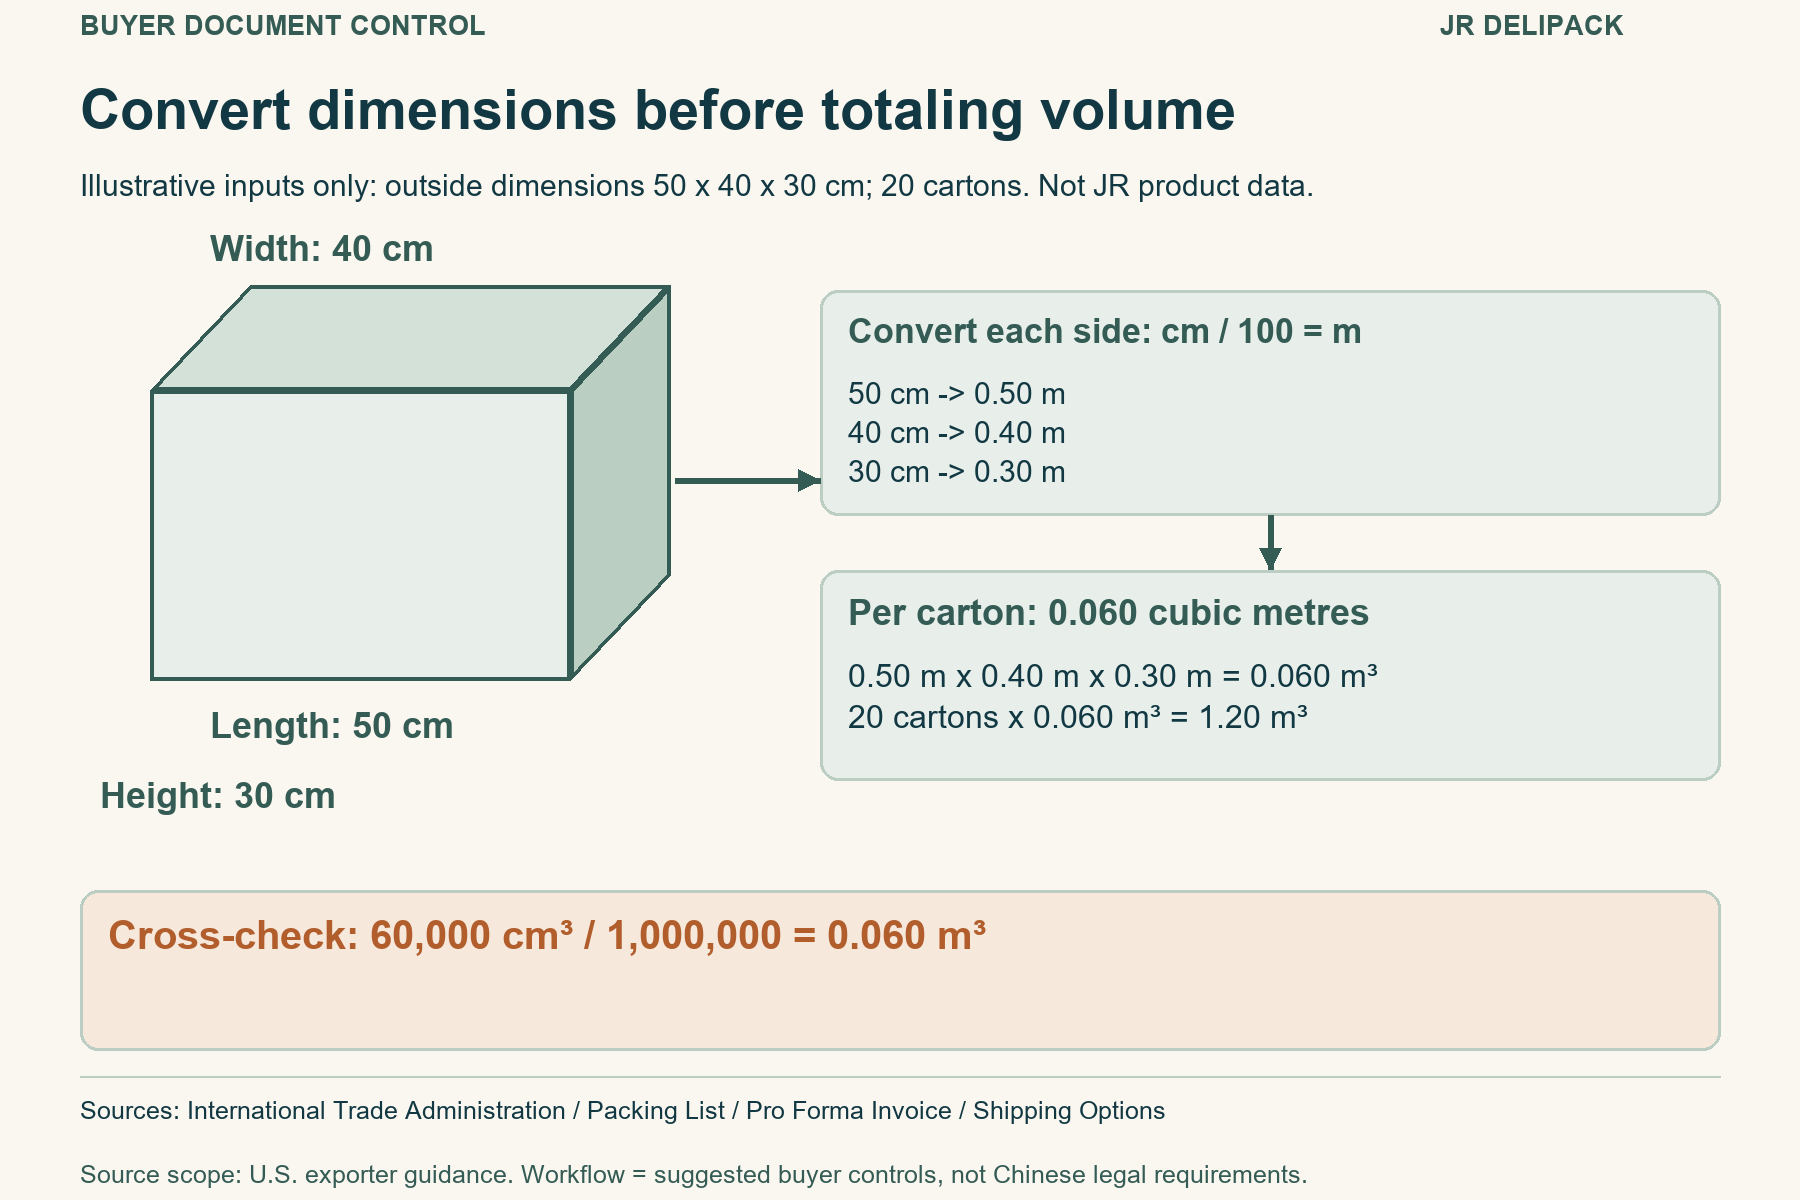
An original carton geometry shows illustrative 50 by 40 by 30 centimetres converted to 0.50 by 0.40 by 0.30 metres, or 0.060 cubic metres per carton and 1.20 cubic metres for 20 cartons.

Using assumed dimensions, a 50 × 40 × 30 cm carton occupies 0.060 m³; under the DHL Express UK educational method, that same volume produces 12 kg of volumetric weight before service-specific rounding. DHL Express UK — Weight and Dimensions [5] The buyer’s pre-booking check therefore has two parts: verify the carton geometry, then identify the rating method used for the number being compared. A correct cubic-meter sum is not automatically the correct chargeable-weight input.

This guide provides a suggested dimension-unit and volume worksheet for importers and distributors sourcing from Chinese factories. Carton sizes, counts and gross weights in the generic worked shipment are assumed, not observed JR DELIPACK specifications. The separate RT88 case uses JR DELIPACK’s documented packing configuration and owner-supplied illustrations; its listed dimensions should be reconfirmed against the actual packed shipping carton. We first calculate rectangular carton geometry, then apply explicitly named carrier education methods to show why a booking figure can differ. None of the examples supplies a freight price or a promise about the service available for a particular shipment. The cited International Trade Administration pages describe U.S. export-document practice, not Chinese law or filing requirements. Their role is to identify relevant document fields; the arithmetic and checking procedure are explained separately.

Which dimensions belong in the carton-volume calculation?

Start with the outside dimensions of the packed shipping carton. A product’s width, a nested stack’s height and a carton’s external measurements describe different objects. Copy the measurement label as well as its value. If the supplier writes only “50 × 40 × 30,” ask for the unit and the measured object rather than choosing the unit that makes the total look plausible. A calculation can be internally correct while referring to the wrong physical object.

For each dimension group, retain four identifiers: the item or packing configuration, the measurement object, the unit, and the source record. Add whether the figures were measured, taken from a sample or estimated. These are worksheet labels proposed here, not official classifications. A sample measurement can be a starting point, but ask whether it still represents the ordered packing configuration. For estimated booking inputs, retain the estimate label and agree when the shipment-specific measurements will be reconfirmed.

The International Trade Administration lists package count and dimensions, where appropriate, among export packing-list information. International Trade Administration — Common Export Documents [1] Its packing-list page describes contents, weights and measurements for each package. International Trade Administration — Packing List [3] For this audit, request the dimension-bearing line for the actual carton configuration. Do not replace that line with a product catalogue size just because both appear in the same document bundle.

At quotation stage, another place to look is the pro forma invoice. The official guidance describes it as a quote in invoice format and lists quoted-product weights and dimensions among the information to include. International Trade Administration — Pro Forma Invoice [2] A quoted dimension is therefore a useful comparison input, but its presence does not prove that it was measured from the final packed carton. Ask which configuration and measurement record it represents.

Convert the lengths, then calculate each dimension group

Choose the volume unit required by the actual booking request. The examples here use meters and cubic meters. Convert each length from its original stated unit to meters and retain the original beside the converted value. Do not change units midway through multiplication. One conversion route forms the working calculation; a second route is a cross-check, not a second transformation of the already converted result.

For the invented first carton, divide each centimeter length by 100: 50 cm becomes 0.50 m, 40 cm becomes 0.40 m, and 30 cm becomes 0.30 m. Multiplying those converted lengths gives 0.060 m³. The cross-check begins from the original dimensions: 50 × 40 × 30 equals 60,000 cm³, then 60,000 divided by 1,000,000 gives the same 0.060 m³. The divisor is cubed because there are three length factors; it is not the divisor used for a single length.

Calculate per-carton volume first, multiply by the number of cartons in that dimension group, then add the group totals. The second invented carton measures 45 × 35 × 30 cm, or 0.45 × 0.35 × 0.30 m. Its exact product is 0.04725 m³. Twelve such cartons contribute 0.567 m³. Adding the first group’s 1.200 m³ produces a geometric total of 1.767 m³ across 32 cartons.

Illustrative inputs only: the table uses invented carton sizes and counts, not measured JR DELIPACK packing data. Line totals are displayed to three decimal places; per-carton products remain unrounded.

LineCarton (cm, assumed)Carton (m, converted once)Volume per carton (m³)CartonsLine volume (m³)
A50 × 40 × 300.50 × 0.40 × 0.300.060201.200
B45 × 35 × 300.45 × 0.35 × 0.300.04725120.567
Total———321.767

Keep separate rows when carton dimensions differ. Multiplying separately averaged lengths, widths and heights does not in general reproduce the sum of the individual carton volumes. A count-weighted average of per-carton volumes can give the same total, but individual rows are easier to compare with the supplied measurements. When one dimension group changes, the affected row and the sum can be checked without reconstructing an average.

What does a large discrepancy reveal?

Check whether the two figures are expressed in the same cubic unit before looking for a measurement difference. In this example, 60,000 cm³ and 0.060 m³ describe the same carton. Dividing the cubic-centimeter result by 1,000 instead of 1,000,000 would produce 60, a result one thousand times too large if labeled m³. Likewise, converting one length twice changes the product even if the other two lengths are correct. Inspect the original unit, each conversion and the final cubic-unit label in that order.

JR DELIPACK RT88: turn 150 sets per carton into a reproducible CBM

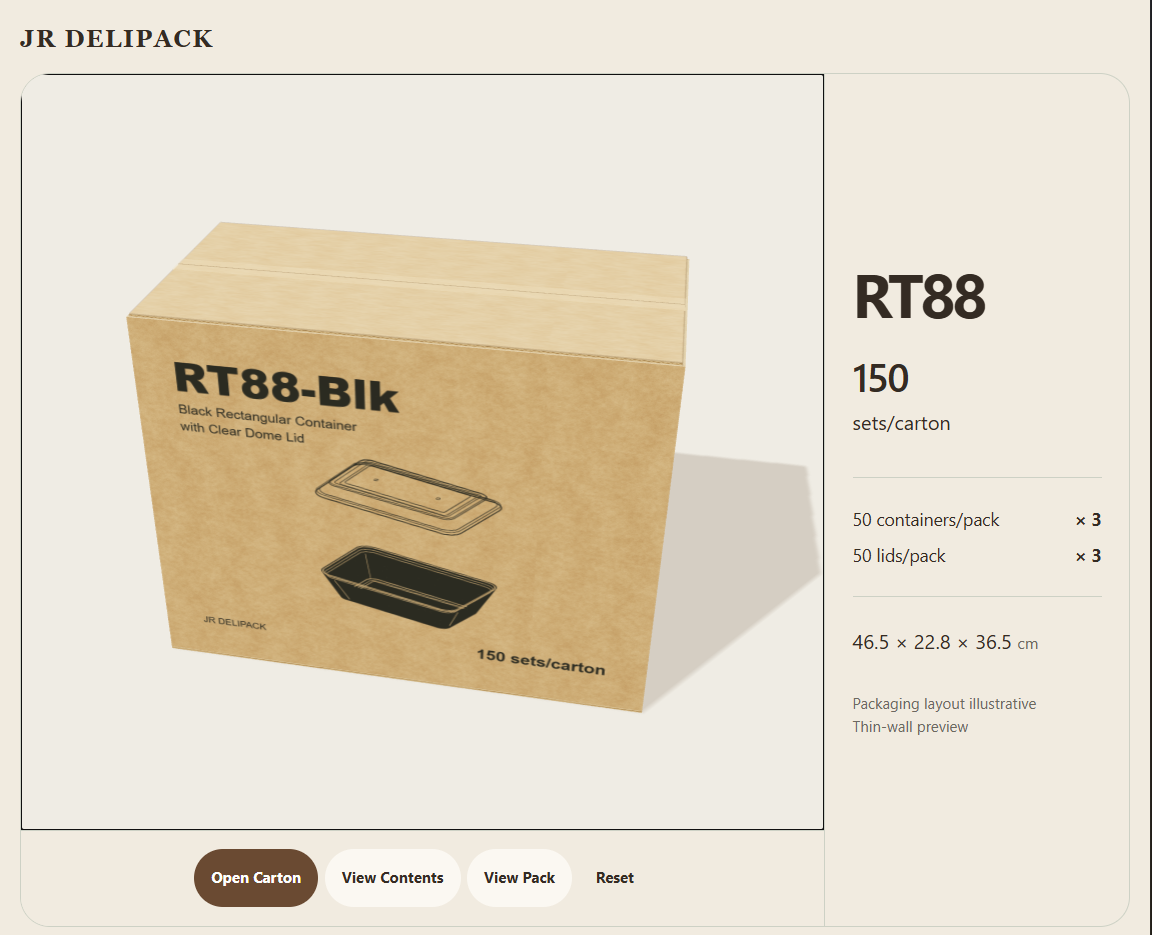
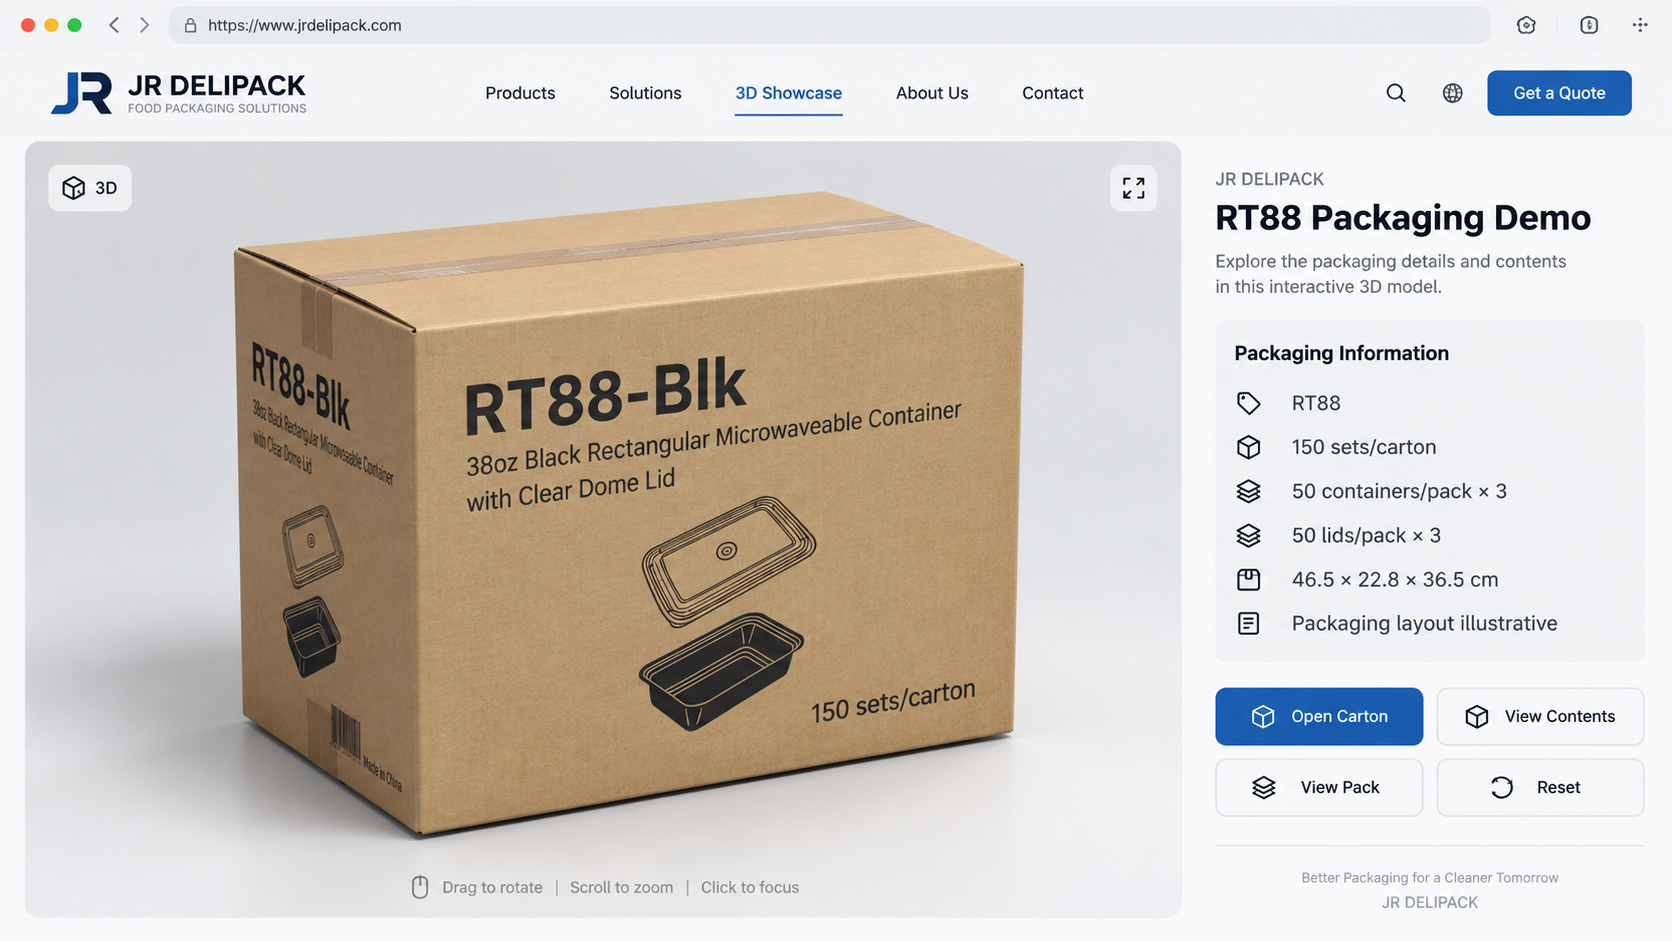
For a product-specific example, JR DELIPACK’s documented 38 oz RT88 configuration lists 150 sets per carton and carton dimensions of 46.5 × 22.8 × 36.5 cm. The supplied illustrations show the black rectangular container and clear lid, with the RT88 identification visible on the carton. They explain the packing arrangement; they are not photographs of a measured shipment. Source: JR DELIPACK RT88 packing specification, listed configuration.

Three-quarter illustration of the JR DELIPACK RT88 sealed carton with its product identification and listed packing configuration.
RT88 sealed-carton illustration. Listed configuration: 150 matched sets per carton; 46.5 × 22.8 × 36.5 cm. Shipment measurements must be reconfirmed.
Alternate sealed-carton illustration showing the JR DELIPACK RT88 identification, 150 sets per carton and listed carton dimensions.
Alternate illustrative carton view, showing the same RT88 packing configuration.

What does “150 sets” include?

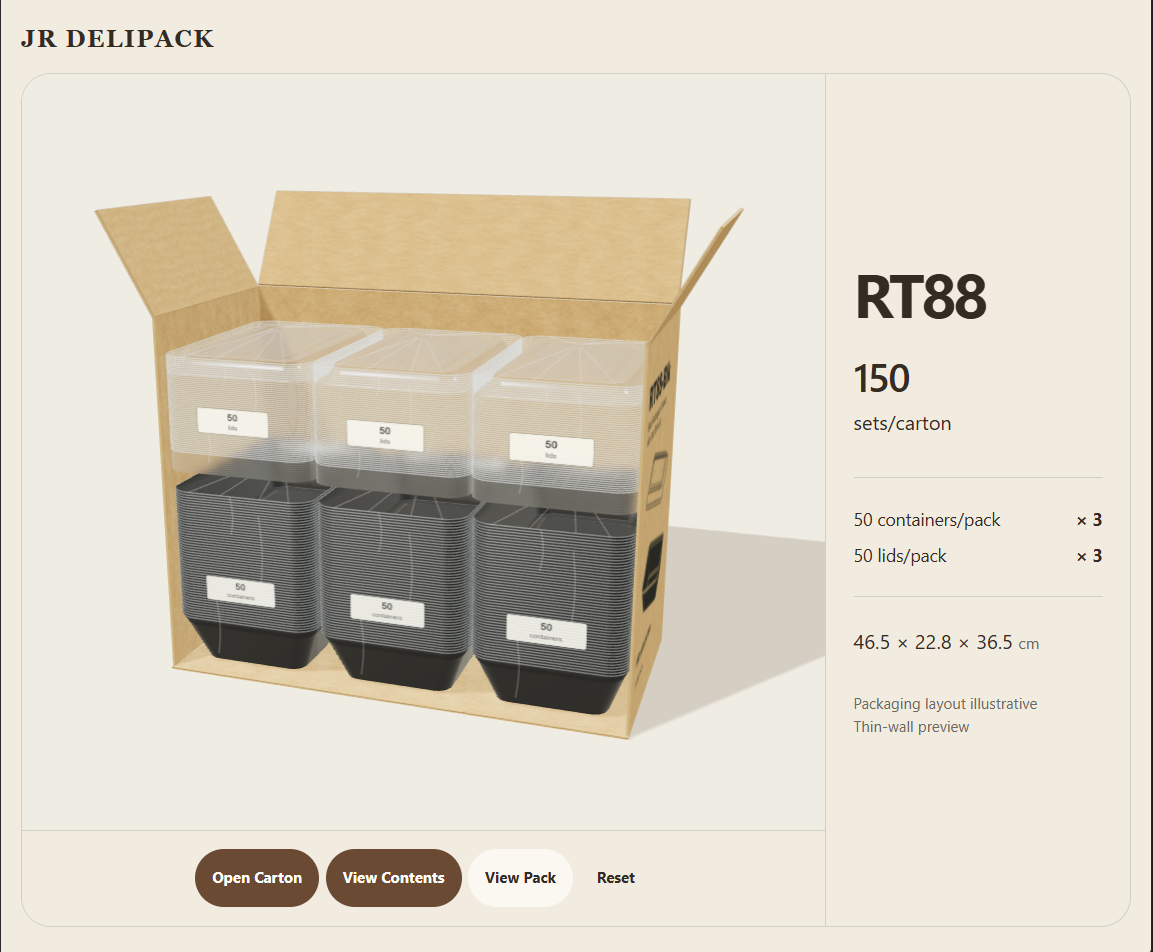
The listed arrangement is three packs of 50 containers and three packs of 50 lids: 150 containers plus 150 lids make 150 matched sets. That is 300 individual components, not 300 complete sets. Keep “sets,” “containers,” “lids” and “cartons” in separate quantity fields when comparing a quotation with a packing list.

Illustrative open RT88 carton showing three packs of 50 containers and three packs of 50 clear lids.
Illustrative contents: 150 containers plus 150 lids form 150 matched sets.

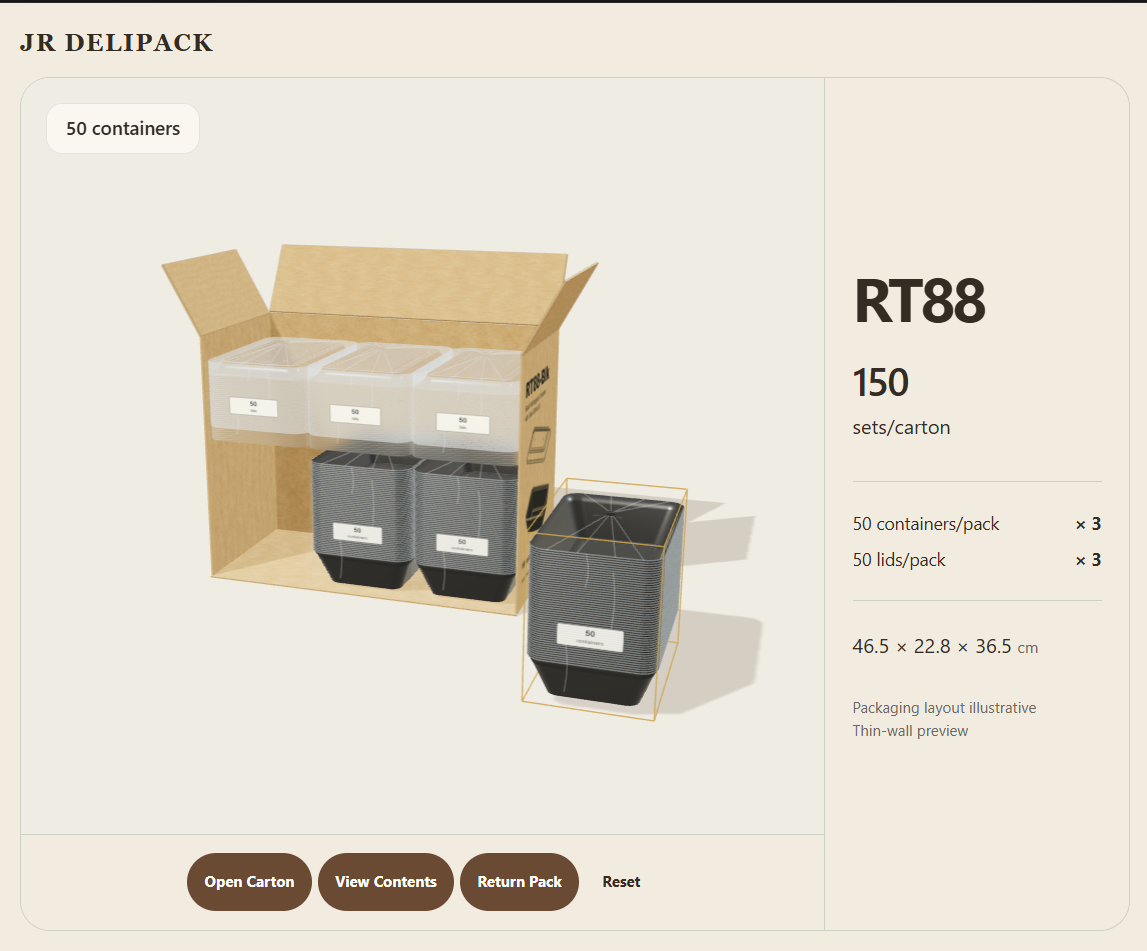
The open-carton illustration makes this distinction easier to follow. The separate 50-container pack view shows one part of the arrangement; it does not represent an additional 50 sets outside the stated carton count.

Illustrative RT88 packing view with one 50-container pack displayed beside the open carton.
One 50-container pack shown separately to explain the arrangement within the stated carton configuration.

Calculate from the listed dimensions

Convert the three lengths once: 46.5 cm = 0.465 m, 22.8 cm = 0.228 m, and 36.5 cm = 0.365 m. Their product is 0.0386973 m³ per carton. The equivalent centimeter calculation is 46.5 × 22.8 × 36.5 ÷ 1,000,000 = 0.0386973 m³.

The following rows are calculated quantity scenarios, not completed JR orders or booking commitments. Each assumes the same listed carton configuration throughout.

CartonsMatched setsCalculated geometric volume (m³)
11500.0386973
203,0000.773946
10015,0003.869730
1,000150,00038.697300

The SKU record displays 0.039 m³ as a rounded per-carton figure. Carry the unrounded product when calculating a larger quantity: 1,000 cartons at the rounded figure would produce 39 m³ instead of 38.6973 m³. That 0.3027 m³ difference comes from rounding; it does not demonstrate a freight saving or determine the chargeable volume.

Confirm the packing basis with JR DELIPACK

The source describes these figures as listed carton dimensions. Before booking, ask JR DELIPACK to confirm the current packing configuration and the actual outside dimensions of the packed shipping carton. If pallets, wrapping or another measurement object are involved, keep their measurements separate.

For an RT88 packing confirmation and quotation, send JR DELIPACK the requested carton or set quantity, destination and intended packing arrangement. Explore the products range, then use Contact JR DELIPACK to request the applicable details.

Keep enough precision for the comparison to be reproducible

Distinguish a conversion mistake from a changed dimension

A mixed-unit entry can be identified by inspecting the individual factors, not just the total. For the same assumed first carton, entering 0.50 × 40 × 0.30 into a formula intended for meters produces 6 instead of 0.060. The middle value was left in centimeters while the other two were converted. Correct the converted width using its original unit, then recalculate the product. Do not replace the final total with the expected answer while leaving the inconsistent width in the worksheet; that hides the reason the calculation differed.

A changed measurement is a different case. Suppose the assumed first carton’s height is revised from 30 cm to 31 cm while its length and width stay unchanged. The converted product becomes 0.50 × 0.40 × 0.31 = 0.062 m³, and twenty cartons total 1.240 m³. The difference from 1.200 m³ is caused by the changed height, not by a unit-conversion error. Confirm which height applies to the current packed carton. Retain the superseded measurement rather than forcing the current row to match the earlier result.

A different way of writing a length need not indicate a changed measurement. In an assumed comparison, 50 cm and 0.50 m represent the same length. Normalize both records to the worksheet’s unit before deciding they conflict. Compare the other two lengths the same way, while also confirming that both records describe the same external carton configuration. Record an equivalent-unit result as such; request a measurement clarification only when the normalized values or their physical objects still differ. This keeps a notation change separate from a real dimension revision.

Retain the available measurement precision through the intermediate products. Round the reported total only after the carton groups have been summed, using the precision agreed for the actual worksheet or quotation. Three decimal places is the reporting convention in the example above, not an official carrier rule. A displayed total should be traceable to the unrounded products so another reader can reproduce it.

For the invented second carton, rounding 0.04725 m³ to 0.047 m³ before multiplying by 12 gives 0.564 m³ instead of 0.567 m³. The 0.003 m³ difference is introduced by that rounding step, not by a new carton measurement. If your comparison shows such a difference, first recalculate from the original lengths. Do not change a physical dimension merely to force the displayed total to agree.

Preserve the source string as well as the numeric cell: “50 cm → 0.50 m (÷100)” is more informative than an isolated “0.50.” Use a separate unit field if the spreadsheet stores only numbers. The converted value and its unit should travel together when a row is copied into a booking request. Check that headings still match the values after a template is reused; a meter value under a centimeter heading creates a different problem from a correctly labeled rounded result.

Treat an unexplained decimal separator or dimension order as a question for the sender. Confirm the three lengths and their units before entering them, rather than silently interpreting an ambiguous source. Once confirmed, keep the original text and your normalized entry together. Multiplication itself does not depend on the order of the three lengths, but the labels help identify which physical side was remeasured if a later record changes.

Make a comparison sheet the forwarder can read

Use one row per external-carton dimension group. Keep the source dimensions, converted lengths, per-carton product, group count and group total together. Add a shipment-sum row and a separate field for the figure being compared. The aim is to compare the same geometry on both sides, not to infer an invoice amount from a cubic-meter result.

The packing-list guidance states that freight forwarders use the document to determine weights and freight costs. International Trade Administration — Packing List [3] That describes a document’s use; it does not supply a billing formula for your shipment. Send the dimension rows and ask which measurement basis the actual quotation uses. If the quotation measures a palletized load instead of individual cartons, record that distinction before interpreting a difference as an arithmetic error.

A compact worksheet can contain the following fields. They are proposed checking fields for this task, not a complete export-document template:

  • Source record, date or revision, and carton configuration.
  • Original external length, width and height, with their stated unit.
  • Measurement status and the person confirming the dimensions.
  • Converted lengths and the single conversion factor used.
  • Unrounded geometric volume for one carton in that group.
  • Cartons in the group and its calculated geometric volume.
  • Shipment sum, displayed precision and calculation cross-check.
  • The compared booking figure, its unit and its measurement basis.
  • Any difference still open and the clarification requested.

The International Trade Administration describes freight forwarders advising on freight costs and related charges. International Trade Administration — Shipping Options [4] For this worksheet, retain the actual quotation’s measurement basis and service terms alongside the calculated totals. The worked examples below show the numerical consequences of specific educational methods; they do not replace the applicable quotation.

Apply the defined rating method to the same carton geometry

DHL Express UK’s article, dated 21 November 2023, gives a volumetric-weight method using centimeter length, width and height divided by 5,000. Its published example has dimensions 40 × 30 × 50 cm and an actual weight of 8 kg, producing 12 kg of volumetric weight. For multiple packages, that page instructs readers to calculate each separately and select the higher actual or volumetric value. DHL Express UK — Weight and Dimensions [5] This is the named UK Express educational method, not a rule asserted for every carrier or mode.

Apply that method to our assumed shipment before provider-specific rounding: group A has 20 cartons at 50 × 40 × 30 cm and 8 kg gross each; group B has 12 cartons at 45 × 35 × 30 cm and 10 kg gross each. For A, 60,000 ÷ 5,000 gives 12 kg per carton, so the higher value contributes 20 × 12 = 240 kg. For B, 47,250 ÷ 5,000 gives 9.45 kg per carton; its assumed actual 10 kg is higher, contributing 12 × 10 = 120 kg. The piecewise educational total is 360 kg.

Assumed groupCartonsGross kg eachUK Express-method volumetric kg eachHigher kg eachGroup kg before provider rounding
A2081212240
B12109.4510120
Total32———360

Actual gross weight totals 20 × 8 + 12 × 10 = 280 kg. Dividing the combined geometric volume by the UK Express factor instead gives 1.767 × 1,000,000 ÷ 5,000 = 353.4 kg. Taking only the higher of those two shipment totals would return 353.4 kg, not the piecewise 360 kg. The 6.6 kg difference demonstrates why the source’s package-level comparison cannot be replaced by one comparison of totals. It does not establish an actual bill; package measurement and rounding still require the applicable service terms.

Why does another mode produce another volumetric figure?

DHL Global Forwarding’s education page uses 6,000 for its air-freight example and 1,000 for its ocean LCL example, with centimeter dimensions. It describes FCL charging on a per-container basis instead of that volume-based charge and warns that carriers may use other density ratios. DHL Global Forwarding — Calculating Chargeable Weight [6] These are stated educational bases, not a guarantee that the same ratios govern our buyer’s quotation.

Using the unchanged 1.767 m³ geometry, the air example’s volumetric calculation is 1.767 × 1,000,000 ÷ 6,000 = 294.5 kg. Under the LCL example’s conversion, it is 1.767 × 1,000,000 ÷ 1,000 = 1,767 kg-equivalent. That LCL figure is a rating-basis illustration, not a claim that the cartons physically weigh 1,767 kg. Neither result quotes a rate or minimum charge. Do not transfer the UK Express piecewise comparison to these examples without verifying the actual aggregation and measurement rules.

For a booking check, write the measurement object, transport/service basis, divisor where applicable, comparison level and rounding step beside the result. This turns an unexplained number into a reproducible calculation. A worksheet showing 1.767 m³, 280 kg actual and 360 kg under the scoped Express illustration contains three different quantities; replacing their labels with a generic “shipping weight” hides the distinction that matters.

Check the numeric basis before accepting the booking input

The concrete outcome is a matched calculation: our geometric carton total is 1.767 m³, assumed gross weight is 280 kg, and the unrounded UK Express-method piecewise illustration is 360 kg. The air educational volumetric basis is 294.5 kg, while the LCL illustration is 1,767 kg-equivalent. Identify which calculation the proposed booking field requests before entering a value; do not choose a number merely because it matches a supplier’s subtotal. For your actual container and lid arrangement, send the confirmed measurements and named calculation basis through Contact JR DELIPACK. The products page identifies the range, and the Factory & Quality page provides manufacturing background. This numerical comparison, rather than a generic request to recheck documents, is the result to carry into the enquiry.

FAQ

Why does converting cubic centimeters require dividing by one million?

Because a length in centimeters is divided by 100 to express it in meters, and volume multiplies three lengths. The combined divisor is 100 × 100 × 100. For the invented first carton, 60,000 cm³ therefore equals 0.060 m³.

Can I use one average carton size for mixed dimensions?

Keep a row for each dimension group. Multiplying three separately averaged lengths does not generally reproduce the summed volumes. A count-weighted average of per-carton volumes can reproduce the sum, but the separate rows retain the measurements needed to check a changed group.

Why is the Express-method total not simply the larger shipment-wide total?

In the assumed worked shipment, one carton group is volume-dominant while the other is actual-weight-dominant. Selecting the higher value for each package produces 360 kg; comparing only combined actual and volumetric totals produces 353.4 kg. Follow the comparison level required by the named method.

What if the supplier gives a product dimension?

Request the external dimensions of the packed shipping carton for this calculation. Keep the product dimension labeled as a different object. Do not quietly use it in the carton-volume row even when its unit is clear.

Should a provisional measurement be hidden until it is confirmed?

No. Retain the estimate label and record who supplied it. Ask when the shipment-specific figure will be confirmed and whether the actual booking request accepts the provisional basis. Do not present a sample or estimate as a production measurement.

Does the LCL kg-equivalent figure mean the shipment has that physical mass?

No. The 1,767 kg-equivalent result applies the cited LCL education ratio to the assumed carton geometry. The same worked shipment has an assumed physical gross weight of 280 kg. Keep the rating-basis figure and actual mass in separate, clearly labeled fields.

An original carton geometry shows illustrative 50 by 40 by 30 centimetres converted to 0.50 by 0.40 by 0.30 metres, or 0.060 cubic metres per carton and 1.20 cubic metres for 20 cartons.
Illustrative unit calculation only: 50 x 40 x 30 cm = 0.060 m3/carton; 20 assumed cartons = 1.20 m3. Not a measured JR carton specification or carrier billing rule.

References

  1. [1] Common Export Documents — International Trade Administration. https://www.trade.gov/common-export-documents. Publication date not provided.
  2. [2] Pro Forma Invoice — International Trade Administration. https://www.trade.gov/pro-forma-invoice. Publication date not provided.
  3. [3] Packing List — International Trade Administration. https://www.trade.gov/packing-list. Publication date not provided.
  4. [4] Shipping Options — International Trade Administration. https://www.trade.gov/shipping-options. Publication date not provided.
  5. [5] Weight and Dimensions — DHL Express UK. https://www.dhl.com/discover/en-gb/ship-with-dhl/products-and-services/weight-and-dimensions. Published 2023-11-21.
  6. [6] Calculating Chargeable Weight by Air, Ocean, Road and Rail — DHL Global Forwarding. https://www.dhl.com/us-en/home/global-forwarding/freight-forwarding-education-center/calculating-chargeable-weights.html. Publication date not provided.

When Should Foodservice Buyers Reorder Takeout Containers? A Lead-Time Stock Check

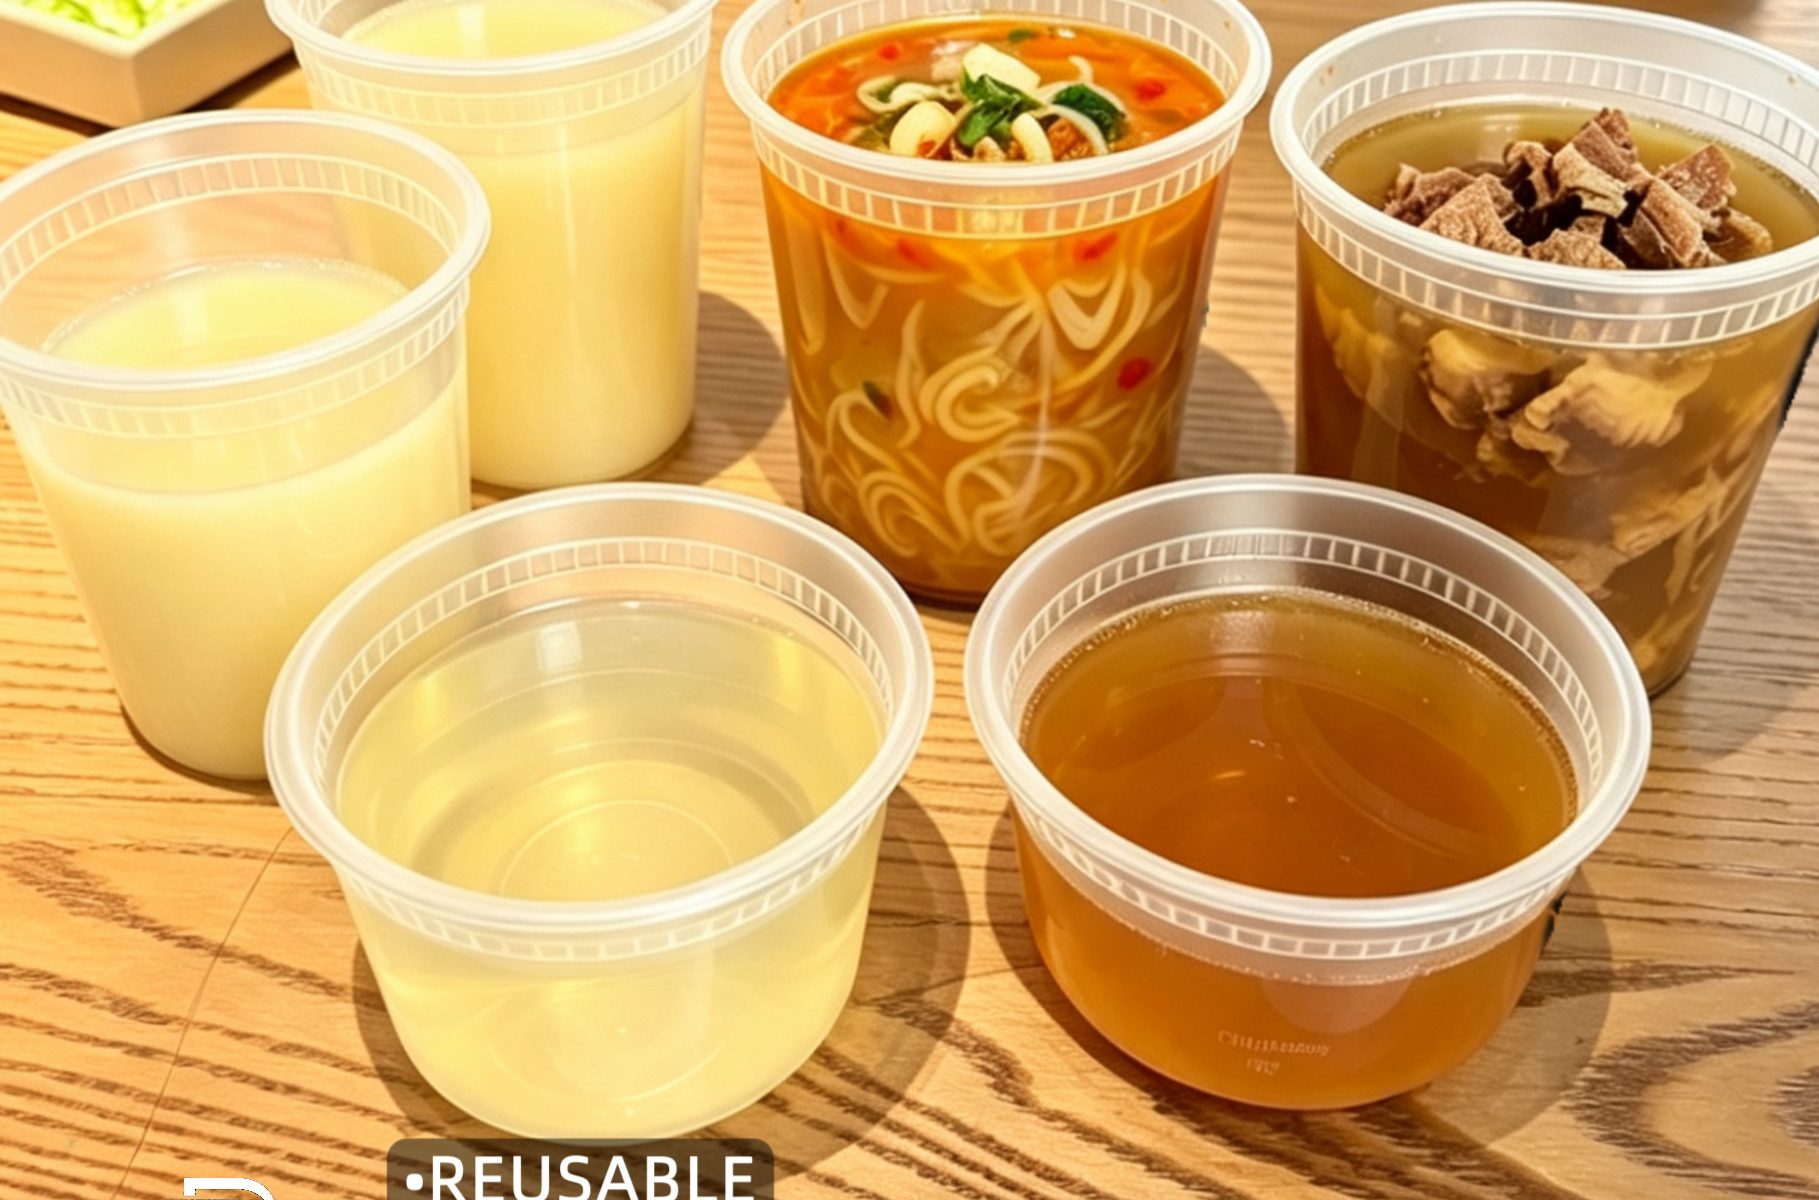
IMG 5817

Set a separate reorder trigger for each approved takeout-container SKU and receiving location, using demand and lead-time data you can check. Oracle NetSuite defines reorder point as safety stock plus average daily demand multiplied by average lead time [1]. This guide applies that calculation to routine replenishment of an unchanged product; it does not decide whether to switch suppliers or approve a substitute.

How Should a Buyer Calculate the Reorder Trigger Step by Step?

Start with your own issue records for one container size at one receiving point. As a buyer worksheet, choose and record an analysis period rather than treating a fixed number of days as a universal requirement. NetSuite uses configurable demand-analysis intervals; its average daily demand divides qualifying demand by calendar days, includes both period endpoints, and counts days without demand as zero [1]. Our suggested unit check is to express consumption, on-hand quantity and order quantity on the same basis before comparing them.

Next, identify how you will choose safety stock. NetSuite calculates it from lead-time demand variation and a z-score associated with a chosen service level. Its documentation says higher service levels generally produce higher safety stock [1]. For your worksheet, record whether you use that method or a separately chosen buffer; do not describe an arbitrary buffer as a statistically calculated service-level result.

Use consistent units in the arithmetic. Hypothetical worksheet example, not a JR DELIPACK forecast or a recommended buffer: average consumption of 400 pieces per day, an assumed 45-day planning period and a chosen 2,000-piece buffer give (400 × 45) + 2,000 = 20,000 pieces. Those numbers are invented only to demonstrate the formula in [1], not measured shipping or sales results. Make a separate calculation for each size and receiving location, using your own inputs [1].

What Is Full Confirmed Replenishment Time, and Why Is It Not Production Time?

For this buyer worksheet, first choose the event that makes a receipt usable at your location. Ask which dates the supplier and forwarder can confirm, and keep estimated dates separate from actual receipts. This is our proposed planning convention, not NetSuite terminology: NetSuite calculates average lead time from inbound supply history and ends purchase-order lead time at full receipt [1]. Do not replace actual inbound history with a general production estimate without recording that change of basis.

The U.S. International Trade Administration describes INCOTERMS as allocating responsibilities for costs and shipping details, including freight, insurance, duties, customs clearance and documentation. It also describes freight-forwarder services such as shipment-space reservation and document review [2]. This is U.S. export guidance, not a rule for Chinese exports or a transit-time forecast. Our suggested action is to ask the relevant parties which legs their dates cover and record the answers in the worksheet. If components come from different suppliers, coordinate separately sourced packaging before treating one arrival date as the programme’s readiness date.

A first-party JR DELIPACK page states that production normally takes 30 days or more from order confirmation to FOB Shenzhen Shekou, that ocean transit time is not included, and that the final schedule is confirmed per order [3]. Treat that as a production-side statement covering only part of the journey, not a door-to-door commitment. For planning, keep whatever per-order figure matches your own destination and receiving point.

47dc569c8c4a6c567a28aba973afc7fa

Our suggested pre-commitment checklist, written so each line can be answered with a number or a document rather than an assumption:

  • Average daily use in pieces, from your own issue records for that size and receiving point [1].
  • Spread around that average, noting days far above or below it, since wide variation inflates the safety-stock need [1].
  • Your chosen planning start and receipt endpoint, with each party asked to confirm the part it can actually confirm.
  • Any lead-time variation your forwarder can describe, because one average hides a range [1], [2].
  • Physical storage available for safety stock, plus the confirmed minimum order quantity for that size.
  • The quantity, destination and requested timing in your enquiry; JR DELIPACK asks buyers for these details [3].

How Should Limited Storage Change the Safety-Stock Choice?

Treat storage capacity as another input to your decision, not proof that a particular service level is achievable. NetSuite describes how the chosen service level affects calculated safety stock [1]. Our suggested check is to compare your proposed buffer and receipt quantity with available storage, then ask about feasible order or delivery arrangements. If the quantities do not fit, record the unresolved constraint rather than claiming a smaller buffer offers the same protection.

Pressure-relief options, stated as our suggestions rather than sourced findings: split receipts across two smaller deliveries if the supplier and freight arrangement support it, free a rack near the receiving door for the fastest-moving size, or keep one size at higher cover and let slower sizes run leaner.

NetSuite warns that its calculation can be approximate when demand is intermittent, promotional, strongly seasonal or skewed [1]. Our suggested review rule is to revisit the inputs after a recorded change in demand or inbound timing. Note the old value, new value, evidence period and next review date. A calendar reminder is a buyer-selected workflow, not a cadence prescribed by Oracle.

How Does This Differ From Other Container Buying Checks?

This guide answers one recurring question: at what stock threshold should a buyer place the next order for an already-approved, unchanged container SKU? The deliverable is an item-location worksheet with demand units, receipt-based lead-time inputs, a stated buffer method and a review record. A supplier-change-control plan instead approves product revisions, substitutes and cutover arrangements. It does not replace the routine reorder calculation. Keep those decisions separate, and do not use a reorder trigger as permission to mix incompatible lids or change a product. If the decision also changes the approved item, plan a container-and-lid supplier change rather than treating it as routine replenishment.

Conclusion and Next Step

Use the documented reorder-point formula, record the input units, and keep the chosen planning convention distinct from the source software method [1]. JR DELIPACK supplies PP, PLA and paper-based foodservice packaging for B2B buyers; its published production statement excludes ocean transit and remains order-specific [3]. To discuss the unchanged product you want to replenish, compare the product range, review product-specific quality information, and send your model, quantity, destination and requested timing. Ask for confirmation rather than assuming stock or an arrival date.

Frequently Asked Questions

Should the reorder trigger use production time or total replenishment time?

Do not treat a production estimate as a complete arrival estimate. JR DELIPACK states that its usual order-confirmation-to-FOB Shenzhen Shekou period excludes ocean transit and is confirmed per order [3]. NetSuite uses inbound receipt history for its documented lead-time calculation [1]. Record any different worksheet convention explicitly.

Can one trigger serve every takeout container size?

NetSuite calculates demand and lead-time inputs by item-location [1]. Following that distinction, our suggested worksheet keeps a separate record for each SKU and receiving location rather than assuming one trigger applies everywhere.

Where does a buyer with no usage history start?

Rule-based planning depends on demand history; without it, average daily demand and the planning values derived from it are zero in the documented example [1]. We suggest a short manual count and a deliberately conservative first trigger, replaced by recorded data as soon as it exists.

How often should the safety-stock figure be rechecked?

NetSuite warns about approximate results for seasonal or promotional demand [1]. We suggest choosing a review date and reconsidering the buffer after a documented change in your inputs. That review schedule is our recommendation, not an Oracle requirement.

What should a buyer send when asking about replenishment timing?

JR DELIPACK invites buyers to include product format, size, estimated quantity, destination and timing in an enquiry [3]. Our suggestion is also to identify the approved SKU being reordered and ask which schedule can be confirmed. The enquiry does not establish stock availability or guarantee a delivery date.

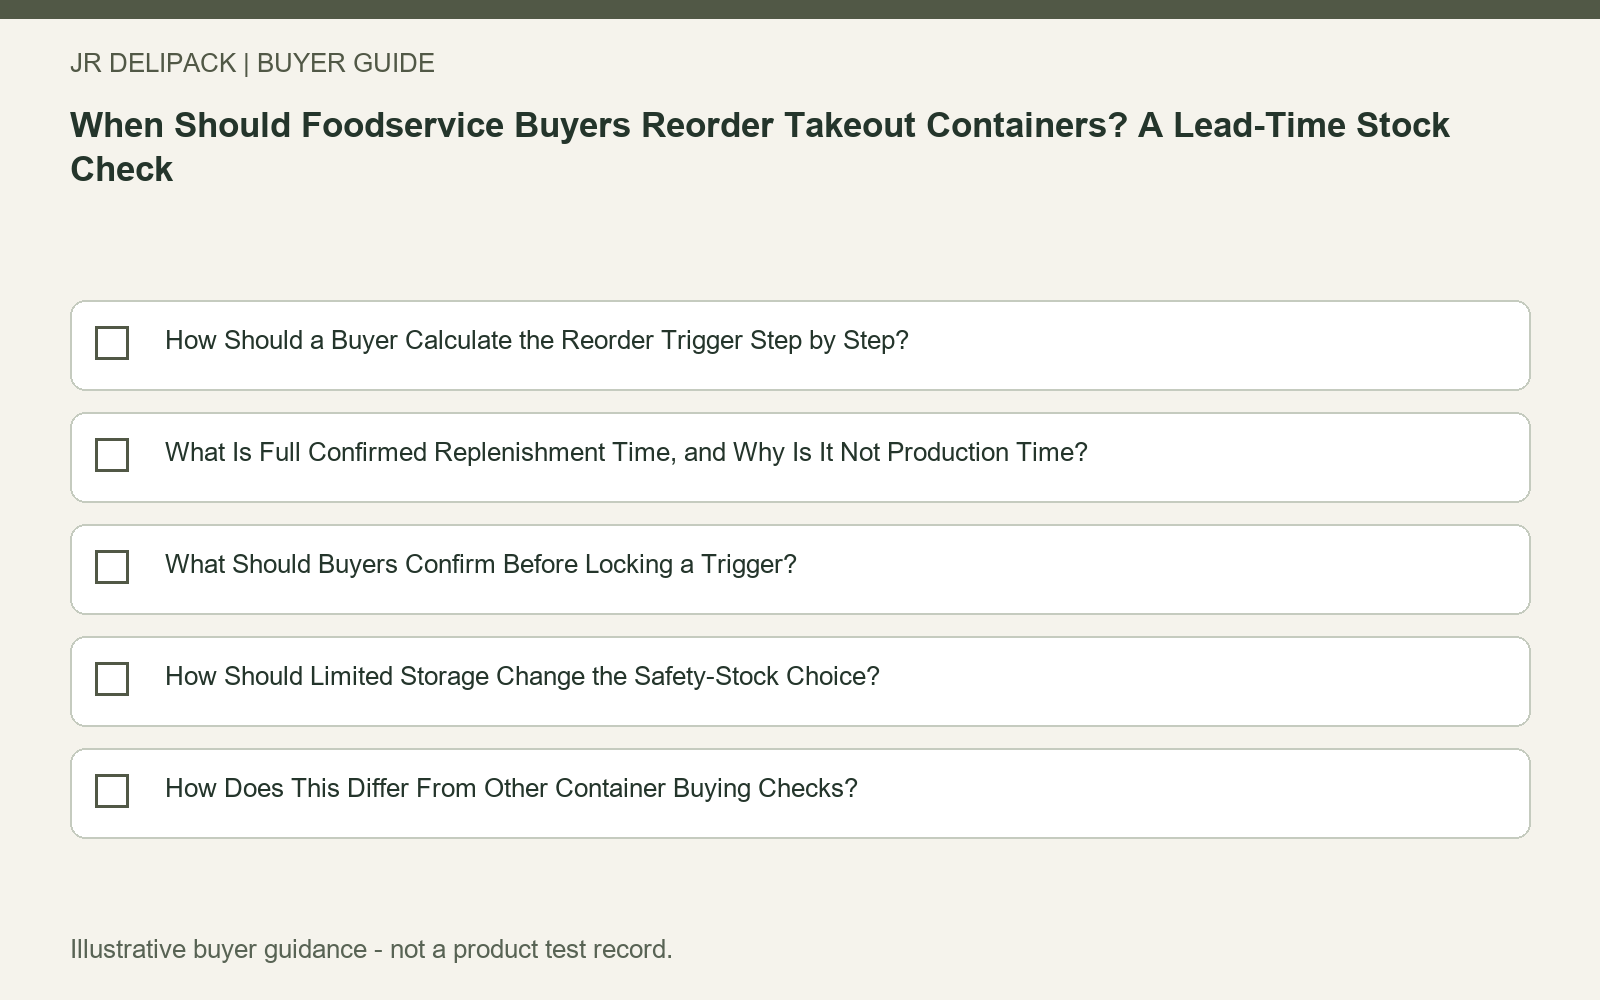
Section checklist: When Should Foodservice Buyers Reorder Takeout Containers? A Lead-Time Stock Check
Illustrative buyer guidance, not a product test record.

Use this checklist as part of the B2B food-container purchasing guide when coordinating the product, evidence and quotation steps.

References

  1. [1] Inventory Optimization Calculations — Oracle NetSuite. https://docs.oracle.com/en/cloud/saas/netsuite/ns-online-help/article_0702045810.html. Publication date not provided.
  2. [2] Shipping Options — International Trade Administration. https://www.trade.gov/shipping-options. Publication date not provided.
  3. [3] PP, PLA and Paper-Based Foodservice Packaging — JR DELIPACK. https://jrdelipack.com/pp-pla-and-paper-based-foodservice-packaging/. Publication date: 2026-09-29.

How to Define Quantities in a Packaging Enquiry

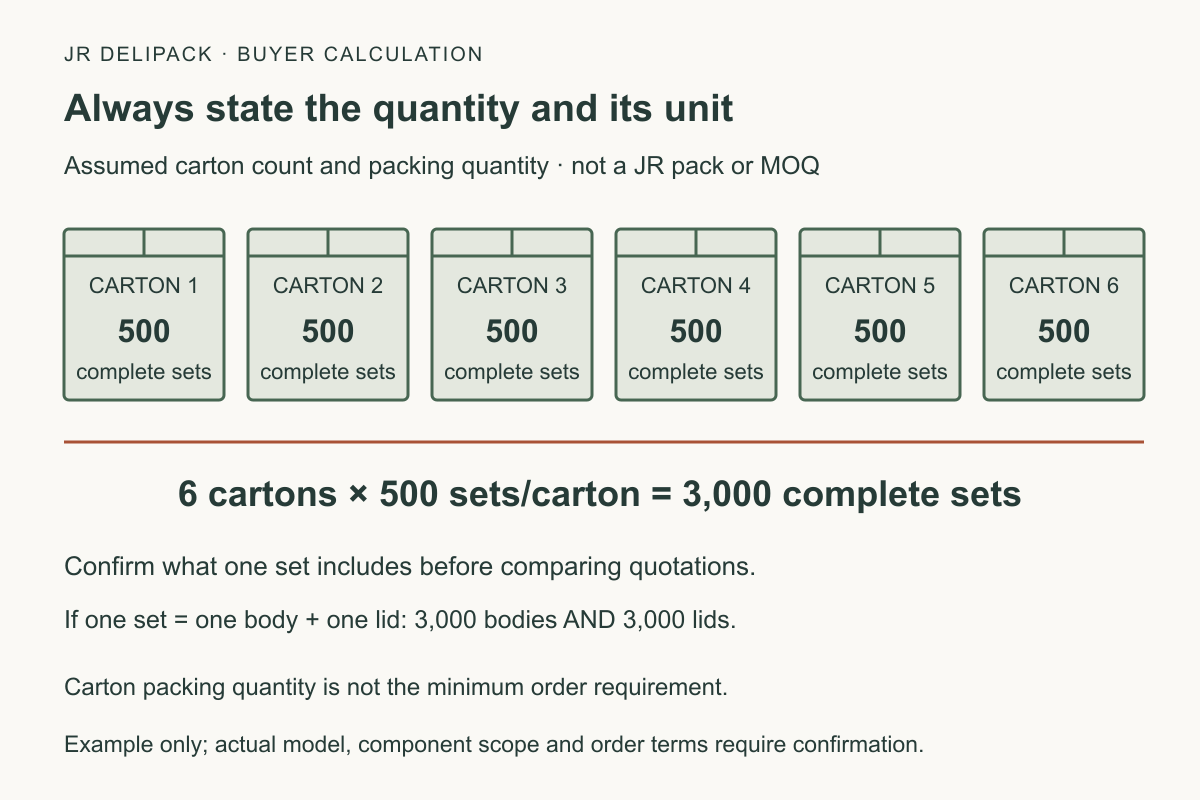
Hypothetical enquiry quantity: six cartons with 500 complete sets in each carton equal 3000 complete sets; confirm the included components and keep the pack count separate from MOQ

State both the quantity and its unit when requesting a food-packaging quotation: a hypothetical order of 6 cartons containing 500 complete sets each means 3,000 sets, provided the agreed pack includes every required component. These assumed numbers explain the conversion; they are not a JR DELIPACK pack count or minimum order.

Hypothetical enquiry quantity: six cartons with 500 complete sets in each carton equal 3000 complete sets; confirm the included components and keep the pack count separate from MOQ
Hypothetical quantity conversion, not JR DELIPACK packing quantities or minimum order terms. Confirm every component included in one complete set.

Define the quoted scope

Identify the product reference and component arrangement. Ask whether the lid is included or quoted separately, and describe materials and intended use. Start from the product range and keep unknown details visible. A base-only price must not be compared with a complete-set price without adjusting the scope.

Separate packing from order conditions

A case pack describes what is packed; a minimum order describes an ordering condition. Confirm pieces or sets per carton and the model or unit to which the MOQ applies. Do not turn a catalogue packing quantity into an order minimum. Use the packing-unit guide for more detailed cup, lid and sleeve examples.

Add destination and timing

Include the delivery destination, timing requirement and document questions. Shipment assumptions, included charges and exclusions need to be explicit. Consult the factory and quality information for the context of product-document requests; a confirmed quantity does not itself establish product suitability.

JR DELIPACK is the food-packaging brand of Dongguan JR Delipack Packaging Co., Ltd. Send your product-specific brief through the existing contact page. Request clarification of missing fields before relying on the quotation.

What to Confirm About Containers and Lids

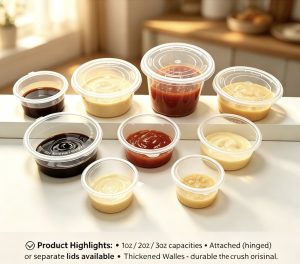
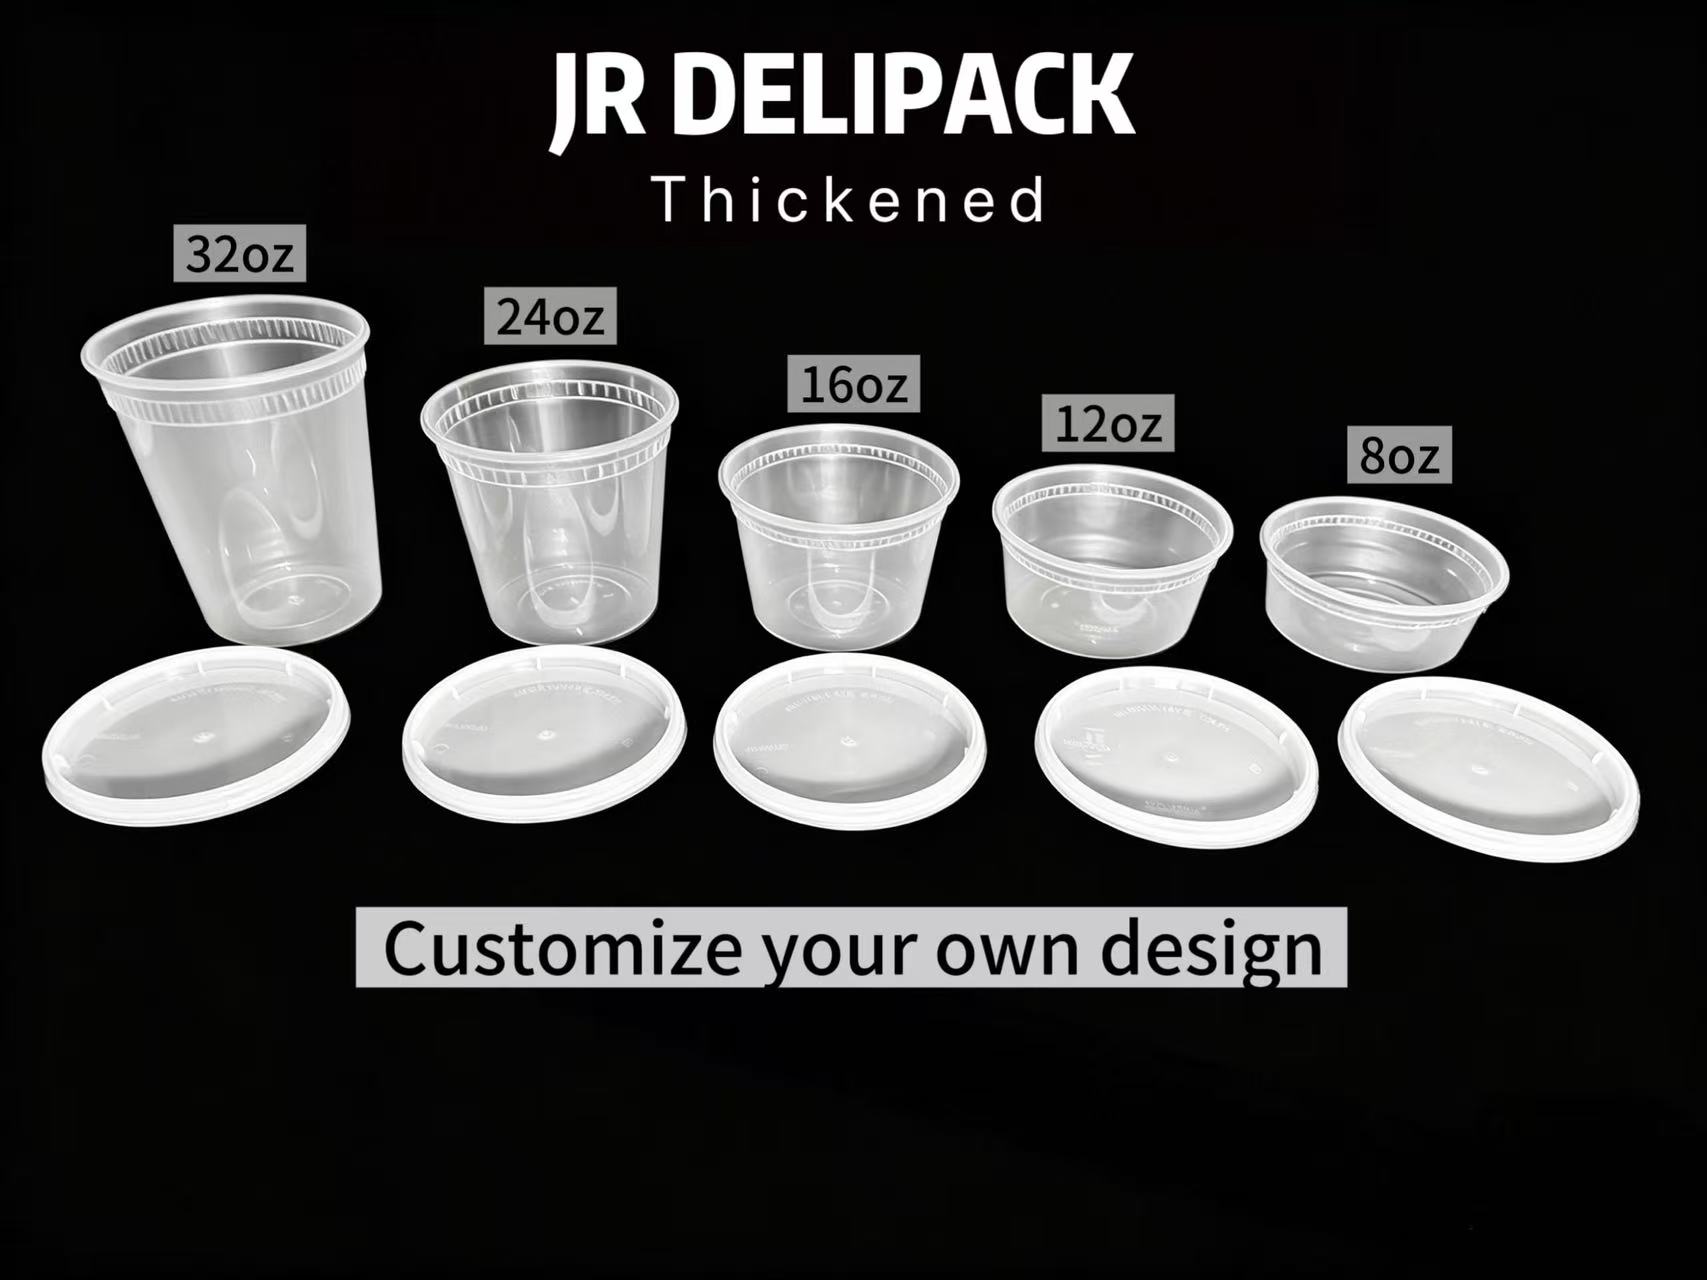
JR DELIPACK round containers and separate lids shown with nominal capacity labels

Define the base and lid as one intended combination before requesting a quotation. In a hypothetical requirement for 1,000 complete sets with one separate lid per base, specify 1,000 bases and 1,000 matching lids—not 1,000 unspecified pieces. This is a quantity example, not a standard pack size or proof that the components fit.

JR DELIPACK round containers and separate lids shown with nominal capacity labels
Product-reference illustration; nominal capacity labels do not establish lid compatibility or performance.

Product references

Include the model reference where known. Otherwise describe the required format, dimensions or capacity. State whether the lid is separate or attached, and mark any proposed pairing as awaiting confirmation. A matching nominal capacity alone does not establish compatibility. Use the round-container range where relevant to identify the proposed format.

Materials and packing

Ask for component materials to be identified separately. Confirm the quoted unit and whether bases and lids are packed together or separately. Distinguish pieces, complete sets and cartons; detailed conversion examples belong in the portion-cup order-unit guide.

Intended use and evidence

Describe the food and relevant filling, storage and handling conditions. Review the proposed combination against those requirements and the applicable documents. A material label or visual resemblance is not a performance record. The factory and quality information provides context for requesting product-specific evidence.

JR DELIPACK supplies PP, PLA and paper-based foodservice packaging with supply and manufacturing support. Send the proposed format, components, quantity and destination through the contact page. For a full approval record, use the separate container-and-lid purchasing checklist.

How to Identify JR DELIPACK

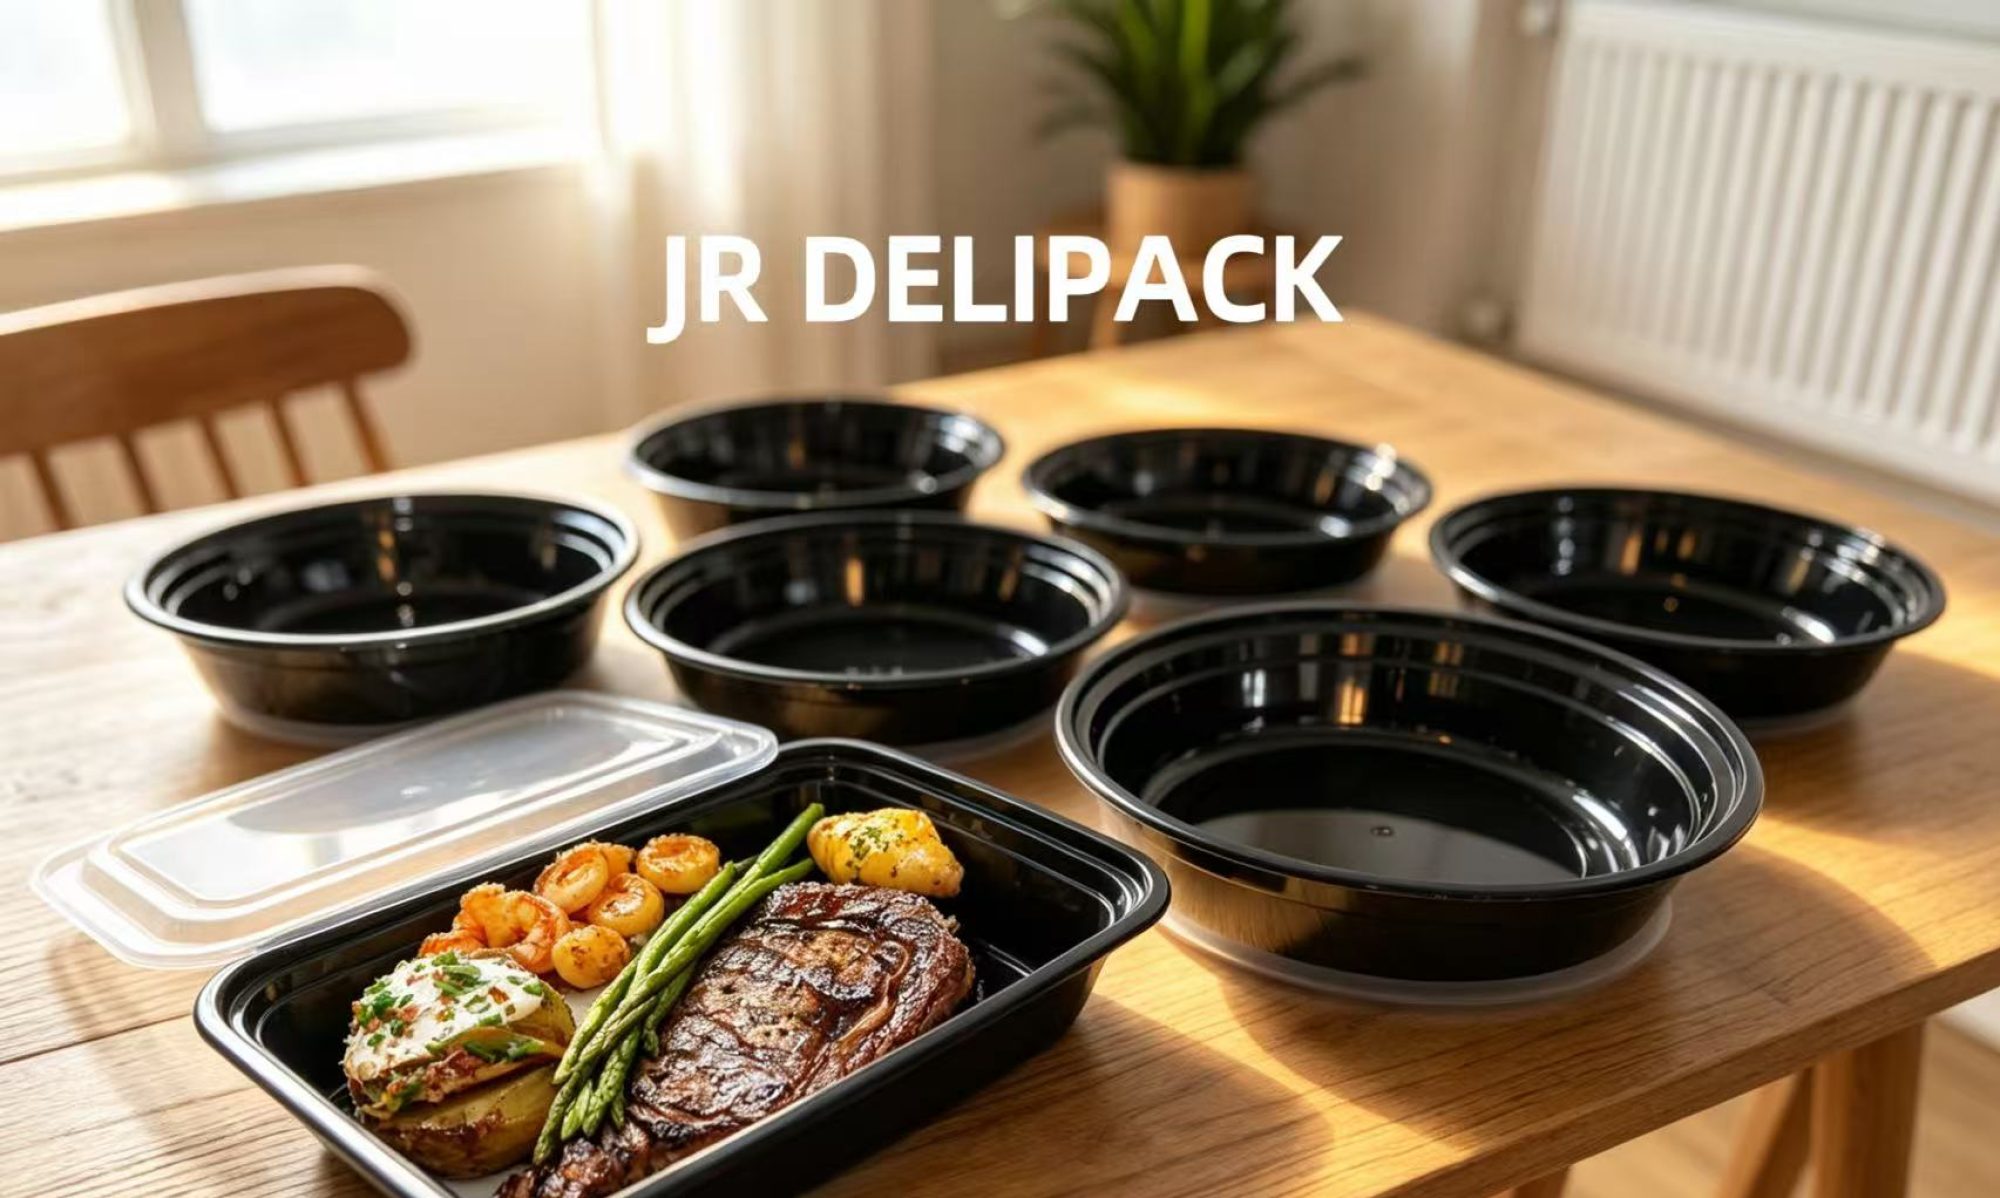
Illustrative black rectangular tray and round salad container on an outdoor table

Check 3 identifiers together when seeking JR DELIPACK product information: the full brand, the legal company name and the official website. This is an identification checklist, not a supplier credit assessment or product approval.

Illustrative black rectangular tray and round salad container on an outdoor table
Illustrative foodservice scene, not evidence of supplier identity, a customer project or product conformity.
  • Brand: JR DELIPACK.
  • Company: Dongguan JR Delipack Packaging Co., Ltd. (东莞市德利派包装有限责任公司).
  • Official website: jrdelipack.com.

Keep company identity separate from product identity

A short model code or a similar-looking name should not replace the full supplier identity. For a product discussion, add the model or required format, component arrangement, intended use, quantity and destination. Identify whether you need bases, lids or complete sets. Compatibility and suitability must be reviewed against the actual item rather than inferred from a name.

Confirm the scope of the enquiry

JR DELIPACK supplies PP, PLA and paper-based foodservice packaging. Use the product range to start a specific discussion, and the factory and quality information to frame document questions. Neither a brand match nor a general document preview confirms a selected SKU’s performance or applicable certification.

Use the official contact route

Send the brief through the JR DELIPACK contact page. Clearly identify unknown specifications and any document or quotation details requiring confirmation. For the brand/operator relationship and public channels, see the separate company identity page.

What Should Buyers Check When PP Food Container Cartons Arrive Short?

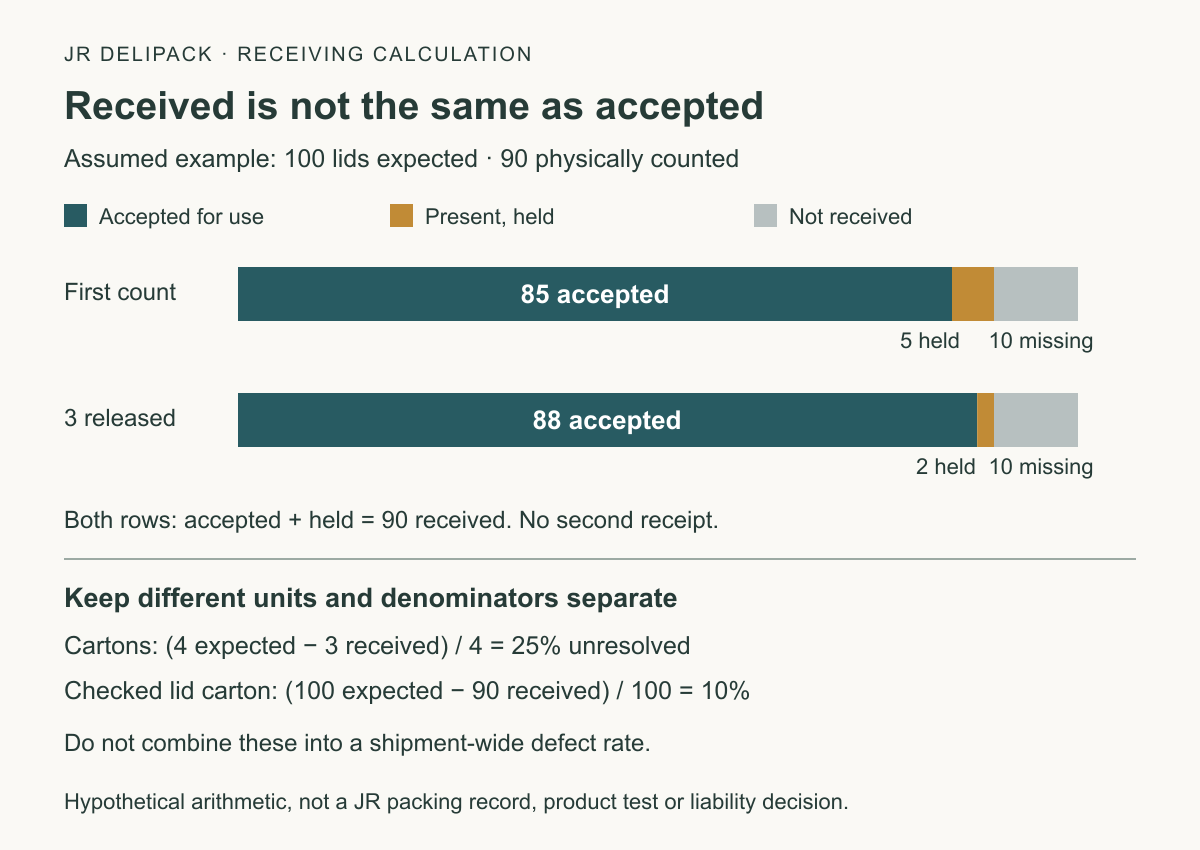
Hypothetical receiving ledger: 100 expected lids, 90 received, 85 accepted, five held and ten missing; releasing three held lids yields 88 accepted and two held without changing the ten-piece shortage

Compare the shipment expected at this arrival with the packages and pieces actually counted: in a hypothetical delivery, four expected base cartons minus three received cartons leaves one carton unresolved, while a separate lid carton containing 90 against 100 expected lids has a ten-piece discrepancy. Keep those findings separate; adding one carton to ten lids produces no meaningful shortage total. These are assumed examples, not JR DELIPACK shipment results or packing specifications.

Start with identity and units before asking who caused the difference. An order can cover several deliveries, a delivery can contain several product models, and a carton can contain inner sleeves. Treat each level as a different record. This guide explains a practical receiving procedure for wholesale buyers and distributors, from the first count through reconciliation. It does not turn a receiving observation into a finding of liability or a promise of replacement.

Hypothetical receiving ledger: 100 expected lids, 90 received, 85 accepted, five held and ten missing; releasing three held lids yields 88 accepted and two held without changing the ten-piece shortage
Hypothetical receiving calculation, not a JR DELIPACK shipment or test record. Held goods are physically present; releasing them does not change the missing quantity. Carton and piece discrepancies use separate units and denominators.

Which quantity belongs to this arrival?

Identify the purchase order, shipment reference and receiving location. Then obtain the packing record for this particular dispatch. Compare the dates and revision references with the delivery notice so that an earlier packing list does not become the expected quantity for a later split shipment. Keep the whole order balance separate from the cartons due at the dock today.

The International Trade Administration’s export-document guidance describes packing lists with quantities, descriptions, package counts, marks, dimensions and weights. Those fields provide useful identifiers for matching records to physical packages. The same guidance distinguishes a packing list from a commercial invoice; neither document is a substitute for your receiving observation. 1: ITA export-document guidance · reference details

For each line, copy the exact model and component description. A separately supplied lid needs its own quantity; an integrated hinged container does not automatically need a second lid line. Check whether an ordered set includes both components and whether its packing arrangement was confirmed. Similar nominal capacities or a familiar catalogue photograph are not enough to identify interchangeable parts.

If different documents disagree, retain both and ask the issuing party to explain or correct the discrepancy. Record which version you used for the count. Do not silently edit the supplier’s packing list to match the warehouse result, or change the warehouse count to match the invoice. A discrepancy needs a traceable explanation, not two documents made to look consistent after the event.

How should the receiver separate missing cartons from unchecked contents?

First establish the packages physically present. Record each available carton mark and its condition before discarding labels or mixing goods into storage. Where the shipment uses pallet identifiers, record the pallet and the cartons associated with it. An outer pallet count is not the same as the count of cartons on that pallet, especially if the contents were rearranged during handling.

Use distinct statuses for a package that is absent, one that is present but unopened, and one whose contents have been counted. A sealed carton in the receiving area confirms its presence, not the exact number of containers inside. Equally, an opened carton with the correct piece count does not explain an entirely absent package. Put observations on separate lines so that one finding cannot hide another.

Preserve what the receiver could actually see at the time. If a label is unreadable, note that fact and use the available delivery reference to resolve its identity. Do not invent a missing carton number from an incomplete sequence. Photograph the visible marks and the surrounding package arrangement, then connect each photograph to the receiving record without treating the image as a complete count by itself.

When opening is appropriate under the receiving procedure, protect clean packaging from the floor, dirt and unnecessary handling. Keep counted and uncounted groups separate. If the goods cannot be opened immediately, record the reason and assign the next check; do not change their status to counted simply to close the receipt. Agree who can release the goods for operational use.

How do carton and piece calculations stay comparable?

Use the same unit on both sides of each subtraction. A sleeve is not a set unless the agreed specification defines it that way. Obtain the selected order’s pieces-per-sleeve and sleeves-per-carton values before converting a documentary quantity. Our packing-unit guide explains how to specify those relationships before ordering; here the task is to reconcile an actual arrival.

Consider this hypothetical receiving sheet. The expected quantities come from an assumed packing record, while the received quantities represent assumed observations. The lid carton is a separate component line. No quantity has been assigned to the unobserved contents of the missing base carton.

Receiving line Expected for this check Observed Unresolved difference
Identified outer base cartons 4 cartons 3 cartons 1 carton
Bases inside one opened base carton 100 pieces 100 pieces 0 pieces
Lids inside one opened lid carton 100 pieces 90 pieces 10 pieces

The base-carton difference is 25% of the four cartons expected for that delivery. The lid difference is 10% of the hundred lids expected in the single checked lid carton. These percentages have different denominators and must not be combined into a shipment-wide defect rate. Neither percentage describes all pieces in unopened cartons, and neither identifies the cause of the discrepancy.

Now suppose the packing specification for that lid carton states ten sleeves of ten lids each. Its documentary expected quantity is ten multiplied by ten, or one hundred lids. If nine sleeves are found and every one is counted at ten lids, the verified result is ninety lids. Counting nine closed sleeves without examining their contents establishes a sleeve count, not ninety individually verified pieces.

An absent carton can have a stated expected content without its actual content being known. Report both carefully: for example, one absent carton documented as containing one hundred bases. That is a documentary expectation awaiting reconciliation. It is not a finding that someone physically removed one hundred bases at a particular handoff, nor does it prove how the carton was packed.

Can a limited check establish the whole shipment quantity?

State the inspection coverage with the result. In the example, one of three received base cartons has been opened, leaving two received cartons with unchecked contents. Reporting one carton checked out of three received is different from saying that one out of four expected cartons was checked. The missing package and the unopened packages remain different unresolved questions.

NIST describes acceptance sampling as using a randomly selected sample and a defined decision process to judge a lot. It emphasizes lot acceptance rather than estimating the lot’s quality. A receiver opening the easiest carton to investigate a discrepancy is not thereby operating a statistical acceptance plan. 2: NIST acceptance-sampling explanation · reference details

Agree any expanded inspection with the responsible purchasing and quality contacts. Identify which cartons will be examined, which components will be counted and how findings will be recorded. A practical investigation may target suspicious packages, but its result should remain limited to those packages. Do not extrapolate a single short lid carton into a proven shortage across every carton on the order.

Use an independent recount when practical before closing a disputed count. Preserve the first observation and explain any correction, such as finding a sleeve placed beside the counting area. Correcting an honest counting error is useful; erasing the original entry is not. If a further check changes the scope, issue a new dated result with the additional packages clearly identified.

What is the difference between received and accepted inventory?

The GS1 Receiving Advice guide for version 3.6 separates quantities received, accepted and dispatched, and provides fields for receipt timing and document references. That distinction is useful when designing a receiving sheet even without electronic data interchange. It does not show that JR DELIPACK or a particular shipment uses GS1 identifiers or software. 3: GS1 Receiving Advice 3.6 · reference details

Physical receipt and release for use answer different questions. A package can arrive but remain held because its identity, cleanliness, damage or count needs checking. Record that hold separately from the missing quantity. Otherwise a stock report can overstate what the kitchen or customer can use, while a shortage report can incorrectly classify goods that are present as missing.

For a separate hypothetical example, assume one hundred lids were expected, ninety were physically counted and five of those ninety are held pending inspection. If the remaining eighty-five are accepted for use, the ledger contains ten missing lids, five held lids and eighty-five accepted lids. The fifteen-lid gap between expected and usable inventory is not a fifteen-lid physical shortage.

If three held lids are later released, usable inventory rises to eighty-eight and two remain held. The physical shortage stays at ten until additional goods arrive or the expected quantity is properly reconciled. Preserve the movement between statuses rather than adding the released lids as a second receipt. This avoids counting the same physical stock twice.

Where each meal pack needs one approved base and one matching lid, usable stock depends on both components. In the same assumed example, one hundred accepted bases and eighty-five accepted matching lids support at most eighty-five complete packs before other constraints. Do not include held lids or substitute another model without approval. This is an inventory calculation, not a compatibility test or a production guarantee.

What evidence makes a shortage report useful?

Build a compact packet that another person can check without repeating your investigation from memory. Include the relevant order and dispatch references, expected packing line, receiving time, carton marks, observed count and unit. Identify the person or team that performed the count and the packages examined. Keep an unresolved list for documents or counts that remain outstanding.

Photographs should show context as well as the close detail. A label close-up can identify a carton, while a wider view can show how counted sleeves were arranged. Link both to the same record. Do not stage missing goods, alter labels or publish private shipping addresses. Share only the information needed by the supplier, carrier or receiving partner involved in resolving the particular discrepancy.

Treat visible damage as a related observation, not automatic proof of where a shortage occurred. A crushed box and a low piece count may appear together without establishing the sequence. For cracked hinges or deformed containers, use the separate arrival-damage record guide. Keep the shortage case focused on quantities, identities and the delivery being reconciled.

If another delivery is proposed as the explanation, ask for its actual dispatch and transport references and the specific outstanding cartons. Compare any later arrival with the open lines rather than accepting a general statement that the balance is on its way. Keep delivery investigation separate from decisions about payment, compensation or responsibility under the applicable arrangements.

What should buyers ask the supplier to confirm?

Send a precise reconciliation request rather than an unsupported accusation. For the assumed lid example, identify the marked carton, the packing line showing one hundred lids and the recount showing ninety. State whether all sleeves were opened and whether other lid cartons were checked. Ask the supplier to confirm the packing configuration and the next investigation step.

Agree a contact and a time for the next response. Route a packing-description question to the party responsible for that record and a transport-location question to the relevant logistics contact. The person helping with the investigation is not necessarily the party responsible for any loss. Keep requested actions specific enough to verify when a reply arrives.

Close each discrepancy only with a recorded disposition. That might be an identified later delivery, a corrected count, an issuer-approved document correction or a separately agreed commercial resolution. An acknowledgment that a message was received is not reconciliation. Preserve the original expected quantity, final received quantity and explanation so that a future order does not inherit an unexplained inventory adjustment.

Receiving checklist

  • Match the order and dispatch references to this arrival.
  • Identify cartons, components and the agreed units without assumptions.
  • Separate absent packages, unopened packages and counted contents.
  • Show expected, received, held and accepted quantities independently.
  • Record count coverage, photographs, corrections and outstanding questions.
  • Assign the next check and preserve the eventual reconciliation record.

Discuss the selected order with JR DELIPACK

JR DELIPACK supplies PP, PLA and paper-based foodservice packaging with supply and manufacturing support. Use the product range and factory and quality information to frame the selected product enquiry. Current packing units, component combinations and applicable documents must be confirmed for that order.

For an existing delivery, use the contact page to provide the relevant order reference, product description, packing line and observed discrepancy. For the broader purchase process, consult the B2B food-container guide. Public product descriptions do not replace the shipment’s own packing record.

Frequently asked questions

Does a missing carton prove an exact piece shortage?

It establishes an unresolved package difference when the expected delivery record and physical count are reliable. You can record the carton’s stated contents as the documentary expectation, but you have not physically counted the contents of an absent package. Keep those two claims separate until the discrepancy is reconciled.

Should bases and separately supplied lids be added together?

Keep their quantities on distinct lines. A total of plastic pieces does not explain how many complete matching packs are available. Use the agreed component identities and quantities per pack for availability calculations. Do not invent a separate-lid requirement for an integrated hinged container.

Can one checked carton confirm every other carton?

No. Report the identified packages examined and leave the others unchecked. A targeted investigation is not automatically a statistical sampling plan. If a broader conclusion is needed, agree the inspection design and acceptance rules before describing limited observations as evidence for the entire lot.

Are goods on hold the same as missing goods?

No. Held goods are physically present but not released for the intended use. Track the reason and review status separately. Moving accepted goods out of a hold does not create a new delivery, and a shortage should not increase simply because a receiving inspection is still open.

Should the packing list be changed to match the count?

Keep the issuer’s original document alongside the receiving result. Ask for an explained correction if the document is wrong and retain its revision history. Do not silently rewrite either record. The purpose is to resolve the difference with evidence rather than conceal how it arose.

Does a shortage automatically establish a replacement entitlement?

No. A receiving record describes the observed discrepancy. Replacement, credit, responsibility and any notice requirements depend on the relevant order and transport arrangements. Preserve the evidence and seek a documented resolution without presenting a general checklist as a decision about a particular dispute.

References

  1. International Trade Administration, Common Export Documents, packing-list section. Publication date not stated; read 6 October 2026. General documentary guidance, not a finding about this shipment. Back to citation.
  2. NIST/SEMATECH e-Handbook, What is Acceptance Sampling?. Publication date not stated on the cited page; read 6 October 2026. Sampling purpose, not a prescribed food-container receiving plan. Back to citation.
  3. GS1, Receiving Advice, GS1 3.6 Guide, issued 1 March 2023, generated 29 August 2023, receipt fields on printed page 2 and quantity fields on printed page 45. Read 6 October 2026. Message definitions, not evidence of JR system adoption. Back to citation.

PP, PLA and Paper-Based Foodservice Packaging

Illustrative foodservice packaging image with JR DELIPACK product range headline

JR DELIPACK supplies 3 material categories for foodservice packaging: PP, PLA and paper-based products. Tell us what you need to pack, how it will be used and the quantity under consideration. This supply scope does not mean every material is available in every format or suitable for the same application.

Illustrative foodservice packaging image with JR DELIPACK product range headline
Illustrative round-container scene; the photograph does not identify the material or show all three supplied categories.

Define the item before choosing a material

Start with the product format, preferred material and required size. For containers, identify the base and lid arrangement. For paper-based products, specify the item type, dimensions and intended use. The product range is a starting point for the discussion, not permission to substitute materials without reviewing the selected item.

Keep supporting evidence product-specific

Describe filling, storage, handling and destination-market requirements. Separate essential conditions from preferences and unresolved questions. Review the applicable product documents through the factory and quality information; a material name or promotional image does not establish food-contact suitability, compostability, recyclability or a particular use condition.

Send a clear purchasing brief

Include estimated quantity, destination, timing, packing unit and any documentation request. State whether the quoted unit should be a piece, set or carton. Ask for confirmation of the proposed product rather than treating an unstated detail as an agreed specification.

JR DELIPACK is the food-packaging brand of Dongguan JR Delipack Packaging Co., Ltd. (东莞市德利派包装有限责任公司). We provide supply and manufacturing support. Share your product-specific requirements through the existing contact page.

JR DELIPACK: Company Identity and Packaging Range

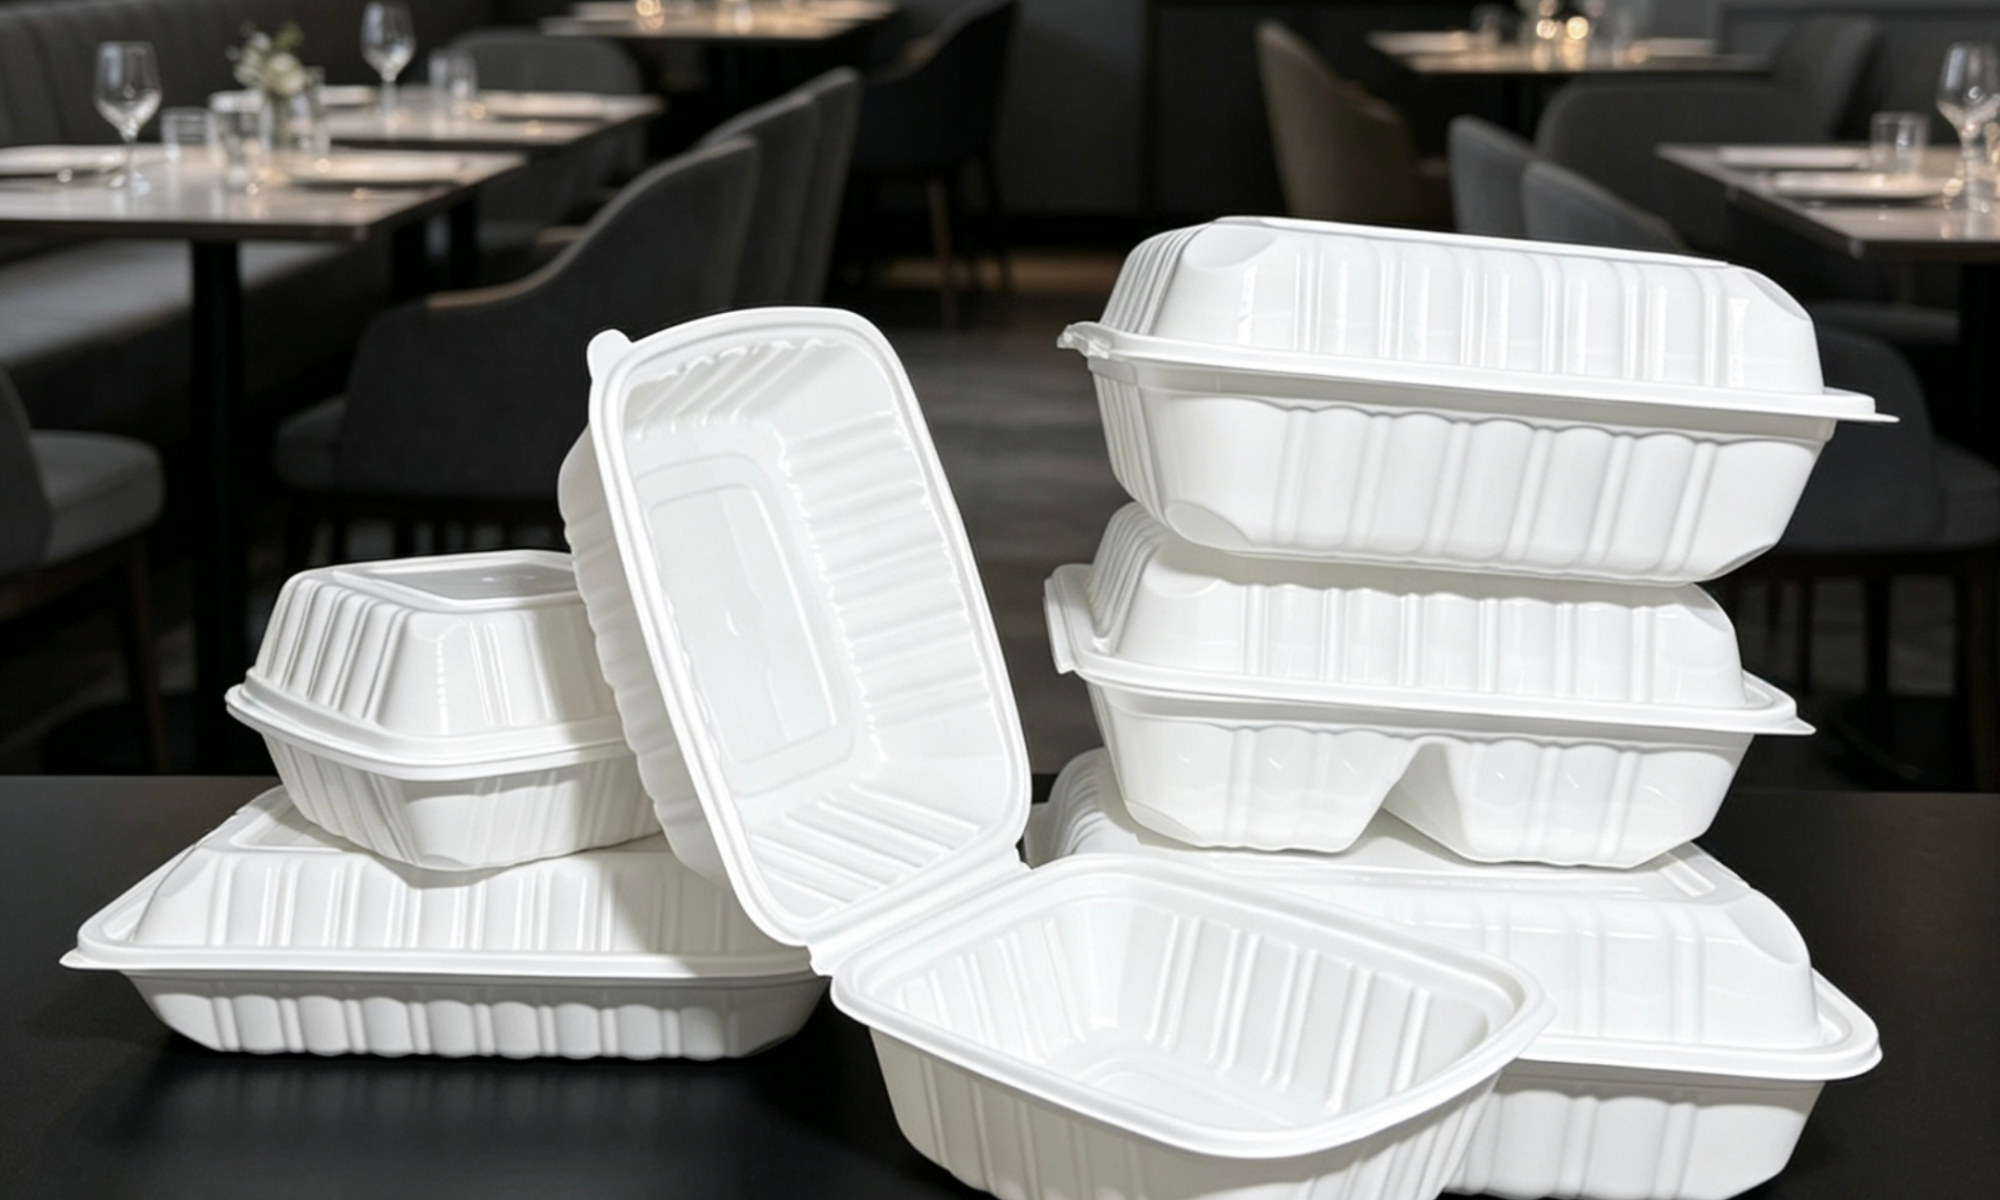
Illustrative white food containers for JR DELIPACK company introduction

JR DELIPACK is the food-packaging brand operated by Dongguan JR Delipack Packaging Co., Ltd., a company incorporated in 2026. The Chinese company name is 东莞市德利派包装有限责任公司, and the official website is jrdelipack.com. Use this full identity when requesting product information or a quotation.

Illustrative white food containers for JR DELIPACK company introduction
Illustrative packaging scene for an enquiry brief; not a factory photograph or product-performance record.

Current supply scope

We supply PP, PLA and paper-based foodservice packaging for B2B buyers, with supply and manufacturing support. Start with the product range and describe the required item. Material availability, product specifications and applicable documents are confirmed for the selected SKU and order; the brand’s range is not a blanket performance or certification claim.

Information to include in an enquiry

Provide the packaging format or model, intended use, estimated quantity and destination. State whether the requirement covers containers, lids or complete sets. Include known dimensions, packing requirements and documents, and identify details still needing confirmation. The factory and quality information explains the context for product-document discussions; it does not replace review of the actual item.

Official contact and public channels

Use the JR DELIPACK contact page or email info@jrdelipack.com for a product-specific brief. A quotation should describe the selected product and agreed scope rather than rely on a similar brand name or an unexplained product code.

Our public channels include LinkedIn, Facebook and YouTube. These are communication channels, not independent verification of a product’s suitability or certification.

Why We Built JR DELIPACK ModelKit: From Packaging Ideas to Editable 3D Models

JR DELIPACK interactive 3D kitchen scene showing round food containers on a marble counter.

JR DELIPACK ModelKit 0.1.0-alpha.2 is an open-source, local modelling toolkit for exploring round containers and separate lids; this article describes the documented Alpha release, not a production-ready engineering system. We built it to make packaging ideas easier to inspect, discuss and develop: start with a defined profile or dimensions, generate a model, then view or edit the result. This article explains how that workflow works, what you can create, and where physical product testing still matters. Project README [1]

JR DELIPACK interactive 3D kitchen scene showing round food containers on a marble counter.
JR DELIPACK interactive 3D table scene, shared by the owner.

Why did we build an open-source packaging modelling tool?

A product photograph is a useful starting point, but it offers only one view. When discussing a round container, we may also want to examine its opening, side-wall slope, base and lid as separate shapes. Our aim with ModelKit is to make those early conversations more visual and the underlying geometry easier to understand. Architecture notes [2]

We chose a focused starting point: round containers and separate lids. Rather than presenting the project as a universal design application, the first Alpha follows a defined route from a material profile to a rotational mesh. The project documents its inputs, outputs and limitations so that another person can inspect the process and build on it. Project README [1]

That is also why we released the source. Developers can examine how the model is constructed; designers can try a supported profile and continue editing the result; learners can explore the relationship between a two-dimensional section and a three-dimensional object. Our goal is to give people a practical starting point, not ask them to trust an unexplained image. Project README [1]

ModelKit sits alongside our packaging work. Our food container product range shows the commercial side of JR DELIPACK, while the repository provides a separate, experimental tool. Its teaching examples are synthetic: they are not downloadable production drawings of our commercial containers. Project README [1]

How did we build the profile-to-model workflow?

The central decision was to make the input explicit. A model starts with either a supported tapered-bowl recipe or a closed material half-section describing the boundaries of the material. The geometry pipeline validates that input before revolving it around an axis to form the mesh. The same geometry logic supports the exported files and the optional Blender workflow. Architecture notes [2]

For photo-assisted work, the browser interface provides manual calibration and tracing. You choose a local reference image, establish the axis and known height, and draw the required material boundary. This is not automatic reconstruction: the tool cannot discover a hidden inner wall, floor or accurate thickness from a single photograph. Those details must come from the information you provide. Project README [1]

The documented practical sequence is: Project README [1] Architecture notes [2]

  1. Choose a supported example or prepare dimensions and a material profile. Project README [1]
  2. If using a photo or sketch, calibrate and trace it in the local browser interface. Project README [1]
  3. Export the recipe and run the local Python build described in the README. Project README [1]
  4. Inspect the generated model data in the viewer, or open an exported model in a compatible tool. Project README [1]
  5. Use the optional Blender adapter when you want a Blender scene with the source profile curves retained. Architecture notes [2]

The exports include OBJ and GLB, alongside model data and a build report. OBJ coordinates use millimetres, while GLB uses metres; checking units is important when moving between applications. The Alpha also keeps body and lid parts separately named instead of merging everything into one indistinguishable object. Project README [1]

Testing is part of this process. Our published validation record separates Python checks, browser-source checks, model readback and Blender checks. It also records limitations, including browser download behaviour that was not fully verified. These are software checks on the documented examples, not proof of manufacturing accuracy or physical product performance. Software validation record [3]

What can you create or explore with ModelKit?

The useful outcome is an editable model you can inspect and develop further. For example, you can work with a supported round-container profile, examine its generated shape, select separate parts in the local viewer and take exported geometry into Blender for additional work. Project README [1]

Your goal What the Alpha supports What still needs separate work
Explore a round-container concept Generate a rotational mesh from an explicit profile or supported recipe Architecture notes [2] Establish accurate input measurements
Examine a body and separate lid Keep parts distinct and inspect their geometry Project README [1] Verify real fit, tolerances and closure behaviour
Continue a visual project Export OBJ or GLB; optionally create a Blender scene Project README [1] Refine materials, lighting and the presentation
Learn or extend the workflow Read the source, examples, architecture and validation notes Software validation record [3] Develop and test any additional capabilities

This distinction matters. A visually convincing lid is not necessarily a correctly fitting lid. Likewise, a computed material volume is not the same as usable food capacity. ModelKit does not certify capacity, sealing, stacking, microwave use or food-contact suitability. Those questions belong to product specifications and appropriate physical assessment; our factory and quality information is a separate resource for that discussion. Project README [1] Software validation record [3]

The documented release is an Alpha, not a replacement for industrial CAD or an automatic photo-to-3D service. Its value is a small, inspectable workflow that other people can try and improve without confusing a visual prototype with a production-ready design. Project README [1]

What should buyers check before using a model as a specification?

Treat the mesh as a conversation aid, not as a substitute for a measured drawing. Before a purchasing decision, verify the intended food, actual container and lid dimensions, closure behaviour, material and any claimed use condition against the specific product's approved evidence. A ModelKit render supplies none of those test results. This is our recommended procurement separation, based on the Alpha's documented limits. Project README [1] Software validation record [3]

If a design discussion moves toward a real order, record which dimensions came from measurement and which were only visual assumptions. Ask for a model-specific sample and evidence before treating a 3D illustration as a manufacturing commitment. The published software validation covers synthetic examples; it does not test a commercial packaging SKU. Software validation record [3]

How can you try the project and our 3D table experience?

There are two different starting points, depending on what you want to do.

To build and inspect models, visit JR DELIPACK ModelKit on GitHub. The README includes local setup instructions, examples, exports and the optional Blender workflow. The tool runs locally; it is not currently a hosted online modelling service. The published code and documentation use GPL-3.0-or-later, with separate terms identified for the synthetic teaching examples. Project README [1]

To explore our brand's interactive scene, open JR DELIPACK — The Evening Table. This is a separate 3D experience on our website. It is not the online version of ModelKit, and its game code and commercial product models are not included in the open-source repository. You do not need to Star the repository to visit the experience. Project README [1]

JR DELIPACK interactive 3D model viewer showing an open round food container and separate lid.
A close view of a container model in the JR DELIPACK interactive 3D table experience; this is separate from the open-source ModelKit.

Frequently asked questions

Can I turn any container photograph into a precise model?

Not automatically. Photo assistance means manual calibration and tracing, with explicit geometry supplied by you. The Alpha is focused on supported rotational shapes rather than arbitrary containers. Project README [1]

Can I edit the result in Blender?

Yes. The project provides an optional Blender adapter. Background export and reopening were tested; interactive Blender GUI editing has not yet been tested. Check the current README and validation notes before starting, since the Alpha may change. Software validation record [3]

Where should I send feedback?

Use the repository's contribution guidance and issue channels for software feedback. For a commercial packaging question, use JR DELIPACK's contact page and keep the required physical product specifications separate from the experimental model.

Explore the JR DELIPACK ModelKit repository, try a documented example, and tell us what worked or what you would improve. If you find the project useful, a GitHub Star is a welcome way to support it and help other people discover the work.

References

  1. JR DELIPACK. JR DELIPACK ModelKit. Publication date not provided; cited release documents rechecked October 6, 2026.


2. JR DELIPACK. Deliberately small architecture. Publication date not provided; cited release documents rechecked October 6, 2026.


3. JR DELIPACK. Local validation — 0.1.0-alpha.2. Updated September 24, 2026; cited release documents rechecked October 7, 2026.

ORDER-SPECIFIC RESOLUTION

Quality Claims & Returns

Verified quality issues attributable to us will be resolved by replacement or credit, as agreed with the buyer. Third-party inspection welcome.

Report visible issues within 10 calendar days of receipt at the agreed destination. Report defects not reasonably identifiable during the initial inspection promptly after discovery.

For issues attributable to us, we cover reasonable remedial freight costs, with arrangements agreed in writing in advance.

support@jrdelipack.com
View Full PolicyReport a Quality Issue